Saturday, May 26, 2012

Atlantic Tropical Season Quick Start: Beryl is Earliest "B" Storm on Record


May 26, 5 PM Update: The chart shows the date of formation for the second named Atlantic tropical cyclone of the season from 1950 through 2012. The average date through 2011 was August 1, so Beryl is nearly 10 weeks earlier than average.

Original post:
Although it's a hybrid subtropical storm, Beryl, which was named late Friday evening (May 25), is the earliest second storm of the tropical season on record in the Atlantic basin since names were assigned beginning in 1950. The previous earliest, and only other second storm as early as May, was Barry in 2007. Although it originated on May 31, Barry didn't reach tropical storm force until June 1. Prior to Barry, the earliest was Beulah on June 15, 1959. The latest was Bonnie on September 17, 1992.

Tuesday, May 22, 2012

Update: Washington DC on Track for Record Warmest Spring;
Century-Old U.S. National Record Being Crushed By Roughly 80%

May 23, AM Update: Thanks to the comment from Anonymous, who points out that the spring 1910 chart originally posted was in degrees F, whereas the 2012 chart was in degrees C! (So much for taking the default plot options from the same web site.) This means that the comparison is not even close. Barring a supernatural "Day After Tomorrow" event in the next 8 days, the U.S. spring temperature record is a complete lock by an incredibly wide margin. Beating a 3-month record over a continent-wide area by such a large amount is so unusual that it didn't look that strange to be comparing Fahrenheit and Celsius. (For the non-mathematically inclined, the conversion factor for F to C is 9/5, or 1.8, so in rough terms, the 2012 anomaly to date is beating the old record by an astounding 80%.)

The 1910 chart below has been updated to degrees C.

Original post:
Following closely on the heels of the third warmest winter and the warmest first quarter, Washington DC is well on its way to the warmest spring on record. The record warmest March was followed by a less extreme, but still above-average, April, and May has rebounded to 4.2° above average. Only 2 days so far this month, the 10th and 11th, have been below average, and that was by just 1° each.

Even without a boost from the expected near-90° temperatures in the upcoming holiday weekend, the March-May average temperature to date of 61.2° is cozily above the current record warmest spring of 60.7° in 1977. Since the normal daily low temperature is near or above 60° for the rest of the month, it would appear that the record is virtually a lock. In fact, applying the forecast temperatures for the next 7 days and the climatological averages for the 29th-31st, the projected final spring average would be 61.8°, which is over 1° above the previous record. This is a bigger margin than the difference between the current 4th place spring (2004) and the 10th warmest (1980).

Looking more widely, the predicted above-average temperatures over most of the U.S. east of the Rockies through the end of the month could contribute to the warmest spring on record for the contiguous 48 states. According to National Climatic Data Center (NCDC) records, the warmest spring occurred in 1910, when the national average was 55.1°. Unfortunately, the data are not available in compatible formats until after the end of the month, but the charts to the right show the temperature departures from average for March-May 1910 and for March 1-May 19 this year.

Note that for this spring to date, there have been no areas which have averaged more than 0.5° below the 1981-2010 normals. Furthermore, temperatures have been 4° or more above average over all or most of North and South Dakota, Nebraska, Kansas, Minnesota, Iowa, Missouri, Wisconsin, and Illinois.

In 1910, these extremes were primarily limited to the Dakotas, extreme northeastern Minnesota, Montana, and half of Oregon, while the southern half of Florida was more than 1° below average.

Thursday, May 3, 2012

Climate Change Curriculum: Teachers on the Front Lines

The PBS News Hour reports on science teachers' attempts to present the subject of climate change without political interference. Teachers share their stories in an online extension of the story.

Watch Teachers Endure Balancing Act Over Climate Change Curriculum on PBS. See more from PBS NewsHour.

Saturday, April 28, 2012

Norfolk VA: High Cost of Adaptation to Sea-Level Rise

"Need to Know" on PBS explores the high cost of adaptation to sea-level rise in Norfolk, Virginia:
When the presidential candidates talk about the long-term economic security of the US, they often talk about the national debt, the viability of Medicare and Social Security, and the rise of China.

But there’s another issue that could have major implications for the nation’s economy, and it’s barely mentioned at all: the soaring costs America might face in generations to come from climate change. More specifically, the very damaging and very costly effects of sea level rise. . .

Watch Rising tide on PBS. See more from Need To Know.

Tuesday, April 24, 2012

Spring Super-Soaker Update: More Rainfall Records Set Across New England, New York

Image (click to enlarge): 24-hour precipitation ending 8 am EDT, April 23, 2012, from National Weather Service

April 24, 1 PM Update: Added Burlington VT, Massena NY, and Rochester NY.

Original Post:
In addition to the many daily rainfall records set on Sunday, April 22, more records were set on April 23 (old record in parentheses):
Providence RI  1.60"  (1.44" 2006)  [second consecutive day] 
Boston MA 1.48" (1.14" 1998)
Burlington VT 1.08" (0.92" 1977)
Portland ME 3.13" (1.53" 1921)
Bangor ME 2.32" (1.39" 2000)
Houlton ME 1.32" (0.86" 1993)
Caribou ME 1.42" (1.31" 1958)
Massena NY 0.83" (0.74" 1993)
Rochester NY 1.58" (0.81" 1996)

Sunday, April 22, 2012

Spring Super-Soaker Sets Rainfall Records;
Century-Old Mark Nearly Doubled at Norfolk

April 24 Update: See next post for more records set on April 23.

April 23, 10 AM Update:
Updated preliminary record daily precipitation reports from the National Weather Service:
Cape Hatteras NC  3.18"  (2.04" 2008) 
Elizabeth City NC 1.22" (1.10" 1959)
Norfolk VA 2.24" (1.18" 1912)
Salisbury MD 1.93" (1.32" 2006)
Georgetown DE 1.67" (1.32" 1993)
Philadelphia PA 1.87" (1.67" 2006)
Allentown PA 1.66" (1.24" 1937)
Avoca PA 1.27" (1.16" 2006)
Atlantic City NJ 1.71" (1.63" 2006)
Trenton NJ 2.06" (1.77" 2006)
Newark NJ 2.64" (1.21" 2006)
Islip NY 2.66" (0.77" 2003)
LaGuardia NY 1.90" (1.53" 1969)
Kennedy Airpt NY 2.14" (1.79" 1969)
Central Park NY 2.45" (1.80" 1969)
Bridgeport CT 1.72" (1.64" 1969)
Providence RI 1.59" (1.43" 2000)
Richmond missed by just 0.01".

In addition to the first-order (ASOS) stations listed, at least 28 cooperative stations from Florida to Maine reported record daily rainfall.

2 AM Update: The Providence record is confirmed at 1.59".

1 AM Update: The following unofficial rainfall totals will also be new records if confirmed:
Philadelphia PA  1.86" (1.67", 2006)
Trenton NJ 2.06" (1.77", 2006)
Newark NJ 2.61" (1.21", 2006)
Central Park NY 2.43" (1.80", 1969)
Bridgeport CT 1.69" (1.64", 1969)
Providence RI 1.53" (1.43", 2000)
9 PM Update: Salisbury has picked up slightly more than half an inch more of precipitation since 5 pm, bringing the total so far to 1.91". Rain has ended at Norfolk.

7:30 PM Update: With light rain continuing, Richmond has now had 0.27" more rainfall since 5 pm; 0.04" additional will tie the record.

Original Post:
The rapidly intensifying storm system moving up the East Coast has already set some daily precipitation records as of 5 pm EDT at several coastal and near-coastal locations (old record in parentheses):
Cape Hatteras NC   3.18" (2.04", 2008)
Norfolk VA 2.20" (1.18", 1912)
Salisbury MD 1.40" (1.32", 2006)
With 1.29" already recorded at Richmond, the 1.60" record set in 1984 is within reach.

Sunday, April 15, 2012

Deluge Douses Des Moines: Earliest 3" Rainfall by 2 Weeks

Image (click to enlarge): Iowa 24-hour precipitation ending 7 am CDT, April 15, 2012, from National Weather Service.

April 15, AM Update: An additional 0.17" of rainfall in the 2 hours before midnight local time brings the daily record total to 3.43". The National Weather Service reports that Des Moines climate records date back to 1878.

Original post:
The 3.26" of rainfall at Des Moines, Iowa on Saturday not only smashes the record for April 14 of 2" in 1987, but it is only the second time that a daily rainfall has exceeded 3" in the first 4 months of the year at Des Moines. The 2.35" which fell in the hour ending at 6 pm CDT was enough by itself to break the old daily record. The all-time record daily rainfall for April occurred on a date 2 weeks later, 3.80" on April 28 in 1974.

Des Moines climate records began in 1896.

Seasonal Outlook

Latest seasonal forecast: Click here.


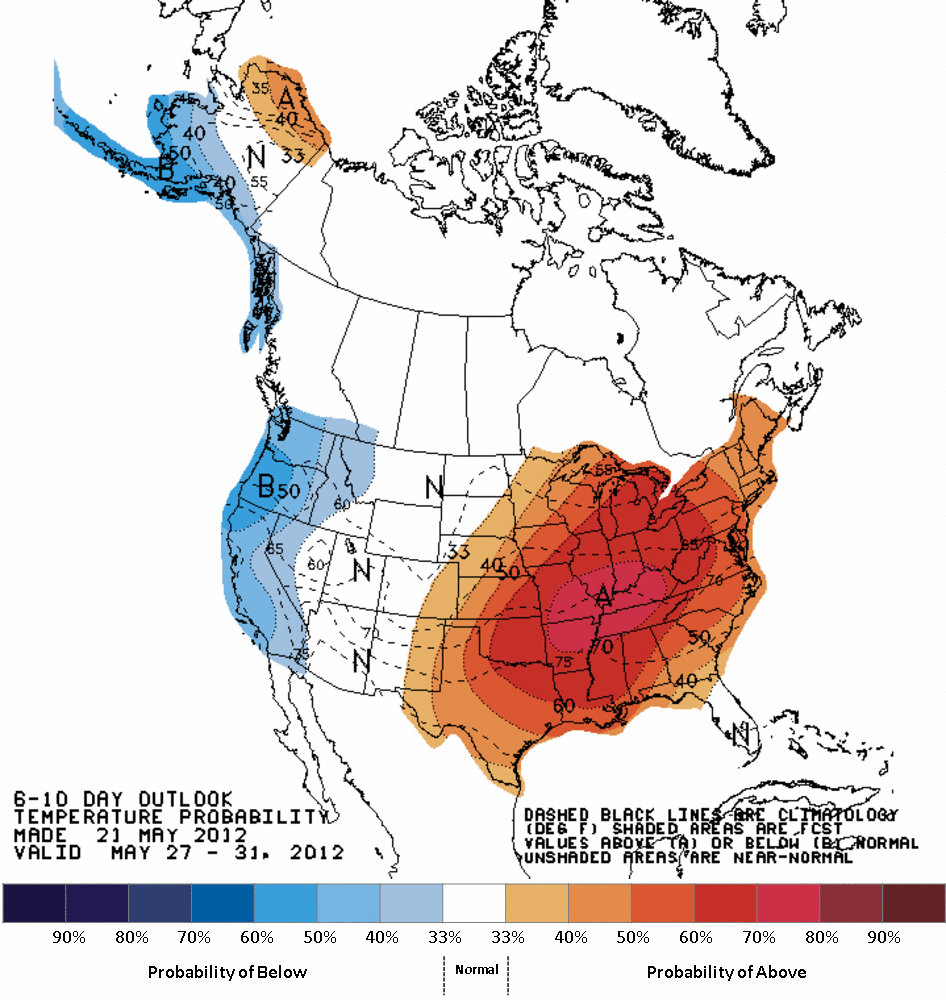
Latest 3-month temperature outlook from Climate Prediction Center/NWS/NOAA.