Showing posts with label Drought. Show all posts

Thursday, November 29, 2012

Washington's 7th Driest November;
Second Biggest October/November Relative Decrease


November 30, 5 PM Update: Added 2012 monthly data and charts.

Original post:
With the mere 0.06" of light rain on Tuesday, November 2012 will close out tomorrow with only 0.60" of precipitation at Washington. That ties it with 1908 as the 7th driest November in 143 years of climate history. The driest was in 1981, when 0.29" was reported.

This exceptionally dry month, following the 5.82" drenching in October, represents slightly less than a 90% month-to-month decrease, second only to the 92% in 1981. In absolute terms, the 5.22" rainfall reduction is the 5th largest on record. The largest absolute October-November decrease was 7.49" in 2005, following the all-time wettest October.

Following wetter-than-average months in September and October, this is now the 9th month of 2012 with below-average precipitation. The November departure of 81% below average is followed by March with a 71% deficit.

The 29.42" total precipitation through the first 11 months is over 7" below the average amount to date. If December rainfall is equal to climatology, the annual amount (marked "Climo" on the chart) will remain the second driest since 2000, behind the 29.95" in 2001. Of the 13 years so far this century, only 4 others have been below average.

November was very dry throughout the Mid-Atlantic region, with nearly all areas below 50% of normal. Large areas from Washington eastward and southward have been below 25% of normal. The 0.71" at Baltimore is less than 22% of normal, and the 1.12" at Dulles is 33% of normal. Richmond's 0.27" is 8% of normal and the 5th driest in records dating back to 1872.


Thursday, July 26, 2012

Total U.S. Dry Area Declines Slightly, But Drought Intensity Increases


The weekly U.S. Drought Monitor report posted this morning shows that the total Abnormally Dry/Drought area declined slightly to 80.1%, but the drought intensity increased. The total Severe to Exceptional (D2-D4) area increased to 45.6%. The area of Extreme drought (D3) jumped by over 5 percentage points to 18.2%, and Exceptional (D4) more than doubled to 2.4%.

From the National Drought Summary:
A strong upper-level ridge of high pressure continued to dominate the nation’s weather this U.S. Drought Monitor (USDM) week, bringing well above-normal temperatures to much of the country east of the Rockies. Beneath the core of the high, hot and dry weather baked the central and southern Plains to Ohio Valley. Monsoon showers and thunderstorms brought areas of rain to the West, cool fronts moving along the high’s northern edge triggered scattered showers and thunderstorms in the northern tier states, and a front skirting the high dropped beneficial rain along its eastern and southern peripheries. July 22 U.S. Department of Agriculture (USDA) reports indicated that 55 percent of the nation’s pasture and rangeland was in poor to very poor condition, breaking last week’s record. In the Plains and Midwest states, crop losses mounted, ranchers liquidated herds, and trees continued to drop leaves and branches. On July 25, USDA Secretary Tom Vilsack designated 76 additional counties in six states as drought disaster areas, bringing the total for the 2012 crop year to 1369 counties across 31 states. Over two dozen large wildfires were burning by the end of the USDM week – most in the West but several in the Plains.
Images (click to enlarge): U.S. percentage area of drought, weekly from January 4, 2011 through July 24, 2012, CapitalClimate chart from U.S. Drought Monitor data; U.S. Drought Monitor map for July 24, 2012

Congress Addresses Drought Crisis Through Action on Farm Bill; Wait, What?

Visit NBCNews.com for breaking news, world news, and news about the economy

Thursday, July 19, 2012

Drought Update: 42% of U.S. Severe to Exceptional


The percentage of the U.S. affected by abnormally dry/drought conditions increased slightly in the past week to 81%, the highest since at least 2000. Meanwhile, the intensity of the drought increased as the severe and above category (D2-D4) jumped 5 percentage points to 42%, also a new 21st century high. The 2 most intense categories (extreme and exceptional), however, are still well below their peaks of 2011.

From the Drought Monitor report:
A strong upper-level ridge of high pressure dominated the nation’s weather this U.S. Drought Monitor (USDM) week, bringing well above-normal temperatures to the central and northern tier states. Clouds with scattered showers and thunderstorms along a stalled cool front kept temperatures below-normal in the southern states. But even then, maximum temperatures were 90 degrees F or warmer across much of the country, with maximums exceeding 100 from South Dakota to Kansas. Philip, South Dakota, reached 109 degrees on July 15. Beneficial rain fell from southern Texas to the southern Appalachians along the front. Excessive rainfall occurred over southeast Texas where amounts totaled 10 inches or more in places, but elsewhere rainfall amounts were generally localized with limited relief. Monsoon showers and thunderstorms brought above-normal rain to parts of the West, but the rain had little impact on deficits which have accumulated over several months. Weak fronts triggered localized showers and thunderstorms along the northern tier states. In between, hot and dry weather dominated from the central Plains to Ohio Valley, Great Lakes, and Northeast.

Another week of hot and dry weather continued the deterioration of crop conditions in America’s breadbasket. U.S. Department of Agriculture (USDA) reports for the week ending July 15 indicated that 38 percent of the nation’s corn crop was in poor to very poor condition, compared to 30 percent a week ago, and 30 percent of soybeans were in poor to very poor condition (compared to 27 percent last week). Fifty-four percent of the nation’s pasture and rangeland was in poor to very poor condition, which is a jump of 4 percent compared to last week and is an all-time high for the 1995-2012 growing season weekly history. About two dozen large wildfires, mostly in the West, were burning on July 17, about half the number compared to a week ago. Streamflows were in the lower tenth percentile of record, or at record low values at several time scales, across much of the Midwest and parts of the central Plains, West, Southeast, and even parts of New England. As a result, the impacts boundaries were shifted to reflect short-term and long-term drought conditions from the west coast to Ohio Valley and Southeast, with short-term conditions indicated in the northern tier states and from eastern Tennessee to New England. Long-term impacts were indicated for parts of the Southwest and central Gulf of Mexico states.

Thursday, July 12, 2012

U.S. Drought Coverage Expands to Decade-Plus High of 80%

Despite increased rainfall, the latest U.S. Drought Monitor report, released this morning, shows that the area covered by some level of drought increased to 80% in the week ending July 10. This is up from 76% last week and is the highest dryness at least since Drought Monitor statistics began in 2000. Although D4 (Exceptional) coverage is still well below the extremes reached last summer, drought area increased for all levels except the lowest, D0 (Abnormally Dry).

CapitalClimate analysis of National Weather Service data from 215 major reporting locations across the 48 contiguous states shows that total precipitation for the week ending July 7 was just 51.5% of normal. Weekly precipitation was less than 0.25" at 125 stations, or 58% of the total locations.

The Drought Monitor national summary:
Rainfall was more abundant than last week. A broken pattern of moderate to locally heavy rains (isolated totals up to 5 inches) covered the central and southern Plains, the northernmost Plains and Great Lakes region, the immediate Ohio Valley, and a good chunk of the Southeast and interior mid-Atlantic. However, the heavier amounts were fairly isolated, and with the hot weather that covered much of the central and eastern United States, only a few scattered areas of dryness and drought experienced significant improvement. In addition, the areas with the greatest temperature anomalies (average daily maxima 10 to 13 degrees above normal) generally coincided with an area of scant rainfall across the Midwest, northwestern Ohio Valley, and southern Great Plains, resulting in another week of widespread deterioration and expansion of dryness and drought in these regions.
Images (click to enlarge): U.S. percentage area of drought, weekly from January 4, 2011 through July 10, 2012, CapitalClimate chart from U.S. Drought Monitor data; U.S. Drought Monitor map for July 10, 2012

Friday, July 6, 2012

U.S. Drought Reaches Maximum Extent In At Least a Decade:
"Areas with record and near-record dryness too numerous to mention"


The latest U.S. Drought Monitor report, issued yesterday for data through July 3, shows that the total area of the 48 contiguous states in some level of drought (over 76%) is the largest since at least 2000. While Tropical Storm Debby virtually wiped out drought in Florida, much of the Southeast remains in drought, with over one-third of Georgia in Extreme or Exceptional drought (D3-D4). Other than Florida, the least droughty areas are generally in the corners: the Pacific Northwest, northern Great Lakes, and Northeast from Pennsylvania through New England.

From the Drought Monitor report:
Overall, this week featured the expansion and intensification of dryness in large sections of the country, with only southern Texas reporting some improvement. Light precipitation (0.5 inch or less) fell on most areas of dryness and drought, with only scattered areas reporting more than an inch, primarily in the northern Plains, lower Mississippi Valley, southernmost Great Lakes region, Appalachians, mid-Atlantic region, and southern Texas. This despite a couple of thunderstorm complexes that pushed rapidly from northern Illinois east-southeastward through the mid-Atlantic, including one on June 29 that caused significant damage, knocked out power for millions of customers, and took 2 dozen lives. Unfortunately, where rain did fall (outside southern Texas), it was not enough to make up for blistering heat that covered the Nation’s midsection, reaching the central and southern Atlantic Coast by the end of the workweek. Both the number of record highs in the past week, and the areas with record and near-record dryness over the last 1 to 3 months, are too numerous to mention. Daily high temperatures averaged above 100 degrees in the central and upper southern Plains, extending eastward into parts of Missouri and Arkansas, and average temperatures for the week were 8 to locally 15 degrees above normal from the Ohio Valley and upper Southeast westward through most of the High Plains. The dryness is beginning to take a significant toll on some of the Nation’s crops, pastures, and rangelands. In the primary growing states for corn and soybeans (18 each), 22 percent of the crop is in poor or very poor condition, as are 43 percent of the Nation’s pastures and rangelands and 24 percent of the sorghum crop. In addition, the area scorched by wildfires expanded significantly. Over 1.9 million acres have been engulfed since the start of the year, and increase of 38 percent in just the past week.
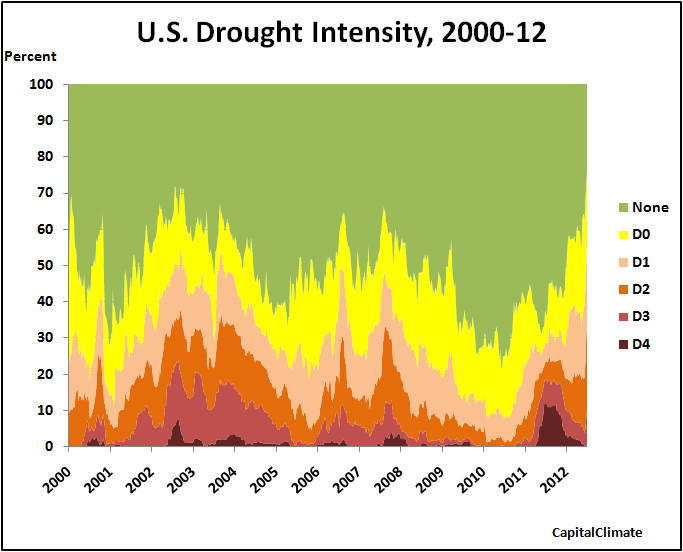
Images (click to enlarge): U.S. percentage area of drought, weekly from January 4, 2000 through July 3, 2012 (top) and January 4, 2011 through July 3, 2012 (middle), CapitalClimate charts from U.S. Drought Monitor data; U.S. Drought Monitor map for July 3, 2012

Tuesday, July 3, 2012

The Cost of Drought: Higher Corn Prices

The inimitable Great Santelli on CNBC this morning interviewed a commodities trader who also farms corn in southwestern Michigan. He said, "Right now we're at a drought situation at my farm. we're looking at five and a half weeks without water. The corn is waist high, getting ready to tassel. We need water."


The Midwest drought monitor (click to enlarge) through last Tuesday shows 71% of the area in some level of drought, with 5% at the Extreme level, mostly in Indiana and Illinois:

Wednesday, June 27, 2012

NWS Briefing: High Plains Heat, Drought Likely to Persist Through Rest of Summer

A video briefing today from the National Weather Service reviews the current drought and excessive heat in the High Plains region and the prospects for the rest of the summer:


Wednesday, January 25, 2012

Dallas Deluge Demolishes Daily Downpour Data;
New January Daily Rainfall Record, Second Wettest January

Following last year's exceptional drought, the climate pendulum has jumped to the opposite extreme, bringing record rainfall and floods to portions of north Texas. Although the National Weather Service reports that the heavy rain has ended, the 3.54" of rain so far today at Dallas is nearly 3 times the old record for the date of 1.28" in 1973. The daily total is also an all-time January daily record, exceeding the 3.15" on January 4, 1998, and it's the second-highest daily total for any winter day (December-February), behind the 4.22" on December 20, 1991.

The January 2012 monthly total to date of 6.04" is approaching 4 times the normal amount of 1.66". It also surpasses the 5.58" in January 2007 to become the second wettest January, behind 9.07" in 1932.

Note: Although the Dallas/Ft. Worth climate record is considered continuous back to 1898, data have been collected at several locations in the area:
  • 1898-1940: Downtown Fort Worth
  • 1940-1953: Fort Worth Meacham Field
  • 1953-1974: Greater Southwest International Airport
  • 1974-present: Dallas/Fort Worth International Airport
Image (click to enlarge): 24-hour rainfall totals ending 1 pm CST, January 25, 2012, in the Dallas region, from National Weather Service

Thursday, October 13, 2011

Exceptional Texas Drought Slightly Dented


Images (click to enlarge):
- Texas drought monitor for week ending October 11, 2011 from NOAA/USDA
- Weekly Texas drought conditions from July 2010 to October 2011, CapitalClimate chart from U.S. drought monitor data
- 24-hour precipitation ending 9 am CDT, October 9, 2011 from National Weather Service
- U.S. seasonal drought outlook, October 6 to December 31, 2011 from Climate Prediction Center/NWS


Long-awaited precipitation in the past week has put the first significant dent in the ongoing Texas extreme drought conditions, but 92% of the state remains in the extreme (D3) or exceptional (D4) category. Exceptional drought, the highest category, has dropped from the peak of 88% of the state last week to 73% currently.

Rainfall in the past week as high as 8" in portions of north-central Texas were as much as 6 times the normal amounts, but larger quantities over a more sustained period are needed to continue reducing the extreme drought. Some 24-hour precipitation totals through 9 am CDT, Sunday, October 9, include:
Comanche          8.30”
Dublin 6.10”
Stephenville 5.78”
Cleburne 5.53”
Mineral Wells 5.14”
Goldthwaite 5.00”
Weatherford 4.79”
Breckenridge 4.77”
Hico 4.72”
Waco Lake 4.35”
Waco Airport 4.28”
Palo Pinto 4.00”
The current drought outlook, released October 6, shows drought persisting through the end of the year in most of Texas, with the exception of some improvement in the panhandle region and adjacent areas of Oklahoma. The outlook was published before the heavy rains of the past weekend, however.

Thursday, September 1, 2011

Exceptional Texas Drought Exceeds 80%;
Mainstream Media Chronic Climatological Challenge Continues

Although slowing from its rapid pace of early spring, the spread of Exceptional Drought, the highest of 4 categories, has continued through the end of summer in Texas. The latest Drought Monitor, released this morning and based on data through August 30, shows that over 80% of the state is now rated D4 (Exceptional):


A chart posted a couple of days ago by John Nielsen-Gammon, the Texas State Climatologist, shows how extreme this year's conditions have been relative to history going back to 1895 (h/t to MT):

The PBS News Hour last night devoted nearly 8 minutes to the subject:

Watch the full episode. See more PBS NewsHour.


Although moderator Gwen Ifill and NPR correspondent and Texas native Wade Goodwyn correctly recognized this as the "worst drought in Texas history", the word "climate" was not even uttered. (Neither was it mentioned in the 3 minutes of coverage on the flooding from Hurricane Irene.) With the governor of the state embarked on a vicious anti-science campaign, shouldn't the question at least have been asked? Apparently the reporters have bought into the inane prayer meme:
GWEN IFILL: As you talk to people, to farmers, to ranchers, to people who depend on rain, do they have any innovative or alternative ideas about how to cope with this crisis, other than to get down on their knees and pray for rain?

WADE GOODWYN: Not really.
Some of the viewers evidently did get the message, anyway:

Doug Stewart said:
I listened and watched in shock tonight and Gwen Hill and Wade Goodwyn, both whom I have long respected, discussed the drought in Texas puzzled while failing to connect the dots to make the connection between global warming and CO2 production. Wade's only solution was to pray for rain. What has happened to your courage and objectivity?
Gordon Pricd said:
Again, a story on the Texas drought - and not a mention of climate change. Given the position of Governor Perry - that climate science is essentially fraudulent - isn't a question journalistically justifiable. Indeed, demanded?

If climate change is no longer a topic that can be credibly raised in the context of some of the worst-ever droughts and floods in the nation's history - major items on the same program - then that's a story all on it's own.
rrjim said:
Most inane coverage and questioning by Gwen Ifil I could imagine. Worst draught in Texas history, Governor of Texas running for president who doesn't "believe in" global warming. But not one question about climate change and maybe the connection? Why is that?

Wednesday, May 18, 2011

Massive Wildfires in Alberta Impact Oil Production


CNBC reported this morning (click image to view video) that massive wildfires in Alberta, Canada, fueled by high winds and very dry conditions, have forced some oil operations in the province to shut down. The fires, which at the peak numbered over 100, have burned entire towns to the ground. The town of Slave Lake, population 7000, has been one-third destroyed, with all residents evacuated.

The government reported on Wednesday that 87 fires were still burning, with 23 out of control, including the one in Slave Lake.

Slave Lake temperatures in the past week have been well above the May average of 9.7°C. The May total precipitation to date of 4.5 mm. is barely over 10% of the normal monthly total of 40.9 mm.; no more than 1 mm. has fallen on any individual day this month.

More video (click to play) from AP, via Google News:


More videos and images at Alberta News.

Image to right above (click to enlarge): May 2011 daily average temperature at Slave Lake, Alberta, Canada, from Weather Office/Environment Canada

Sunday, December 5, 2010

Drought Dispatch: Florida's Fall Increased Intensity


The latest U.S. Drought Monitor report shows that the intensity of the ongoing drought increased in Florida through the last reporting week of November and the end of meteorological fall. As of November 30, only 4% of the state (in the extreme southeast) was free of drought conditions, down from 8% the previous week and 74% at the beginning of autumn. The portion of the state in Extreme Drought (Category D3), the second highest category, was 8%, up from 2% the previous week.

Dry conditions in Florida began to become established in mid summer, and they have steadily increased since then. Although percentages of normal precipitation increased somewhat in November from October's ultra bone-dry levels, particularly in a small area on the southwestern coast and panhandle, they were well below 75% over much of the state.

November precipitation was substantially substandard in most of east-central Florida. The National Weather Service (NWS) reports that the measurable rainfall on November 2 ended a 34-day dry spell at both Orlando and Melbourne. This was the 4th longest rain-free stretch at Orlando on record and the 5th longest at Melbourne. Melbourne was the only major reporting station in the region to report above-average rainfall for the month. The total of 4.62" for the autumn season at Daytona Beach was a new record low, surpassing the 5.37" in 1925.
STATION           NOV 2010      30 YEAR   DEPARTURE     PERCENT OF
RAINFALL NORMAL FROM NORMAL NORMAL

DAYTONA BEACH 0.95" 3.03" -2.08" 31%
(DAB)
ORLANDO 1.68" 2.32" -0.64" 72%
(MCO)
MELBOURNE 3.43" 3.12" +0.31" 110%
(MLB)
VERO BEACH 2.43" 3.04" -0.61" 80%
(VRB)
CLERMONT 1.67" 2.40" -0.73" 70%
(CLRF1)
DELAND 1.74" 2.72" -0.98" 64%
(DELF1)
SANFORD 1.37" 2.96" -1.59" 46%
(SFNF1)
TITUSVILLE 1.71" 3.45" -1.74" 50%
(TITF1)
FORT PIERCE 1.38" 3.50" -2.12" 39%
(FPCF1)
STUART 2.29" 4.23" -1.94" 54%
(STRF1)
Images (click to enlarge): Florida drought monitor for November 30, 2010 from USDA/NOAA--intensity ranges from D0/Abnormally Dry (yellow) through D3/Extreme Drought (red); Florida percent of normal precipitation for October and November 2010, from National Weather Service

Wednesday, July 14, 2010

Midsummer Precipitation Review: Who Ya Gonna Call? Drought Busters!

For more posts on Washington, DC temperature and precipitation, see:
Washington DC Weather Records


July 15 Update: As expected, the new Drought Monitor report including data through Tuesday shows little change from last week.
  • The Virginia total drought area remains at 85.9%, with the Moderate Drought portion increasing slightly to 37.4%.
  • The Maryland total drought area declines to 85.6%, with Moderate Drought down a little to 60.5%.
Original post:
Just when we were getting the "d" word on the brain, the chefs down at Momma Nature's Weather Grill decided to revise the menu. The Washington-Baltimore area has been in the sweet spot for a series of showers and thunderstorms over the last several days. In fact, 5 out of the last 6 days have had measurable rain, and 2 of those had over 1", with over 2" in the 24 hours ending this morning. This brings the Washington July total to 3.77" so far, over 3 times the amount in last year's near-record dry July and a few percent above the normal amount for all of July.

Although lawns and gardens are looking much happier in the short run, the longer-term deficit remains. Five of the 6 months so far this year have been below average. Although March was barely below, February was barely above, so the year-to-date deficit is still 3.42". Furthermore, the heaviest recent rain has been concentrated along the I-95 corridor, so some outlying areas in Maryland and Virginia are still running dry, particularly Southern Maryland, the Eastern Shore and the Northern Neck of Virginia. Even as close as Dulles Airport, the July total is less than half of the Washington National amount. This week's drought report to be issued tomorrow won't include the latest downpours, but conditions should be improved across much of the immediate area.

Here are the regional July precipitation totals to date and monthly/seasonal (since June 1)/yearly departures from average:
Washington National  3.77"/+2.14"/+0.88"/-3.42"
Washington Dulles 1.79"/+0.11"/-2.67"/-2.77"
Baltimore BWI 2.83"/+1.12"/-0.76"/-0.46"
Baltimore Downtown 4.06"/NA/NA/NA
Images (click to enlarge): July 2010 precipitation percentage of normal through 8 am EDT, July 14, from National Weather Service; Washington, DC 2009-10 monthly precipitation and departures from average, CapitalClimate charts from National Weather Service data

Thursday, July 8, 2010

DC Drought Developing

July 10 Update: In a front page article, Baltimore Sun weather reporter Frank Roylance surveys drought impacts on Maryland farms.

Meanwhile, today's showers have put a dent in the short-term deficit; the reported rainfall amounts:
Washington National 1.17"
Washington Dulles 0.61"
Baltimore/BWI 0.42"
Baltimore Downtown 0.33"
July 9 Update: WAMU reports on the effects on Northern Virginia farmers.

Original post:
Recent record-breaking temperatures have exacerbated the effects of low precipitation to produce developing drought conditions across much of the DC/Maryland/Virginia region. The latest U.S. Drought Monitor, released this morning, shows over one-third of Virginia, including all of the DC suburban counties other than Loudoun, in the Moderate Drought (D1) category. This is up from less than 1% the previous week. All of the rest of the state, except the far southwest, is at least Abnormally Dry (D0).

To the north, conditions are even more dire in Maryland, where over two-thirds of the state is in Moderate Drought (64%) or Severe Drought (4%). Nearly all of central Maryland, southern Maryland, and the lower half of the Eastern Shore are in Moderate or Severe Drought. The Severe area covers a portion of the lower western shore of the Chesapeake Bay. Baltimore City, the District of Columbia, and all of their adjacent counties are in Moderate Drought, except for far western Montgomery County.

The map of 30-day precipitation ending this morning shows virtually all of northern Virginia, DC, and Maryland with less than 50% of the normal amount. A substantial portion, probably around 50%, is in the 10-25% range (red area).

Here are the month-to-date, season-to-date (since June 1), and year-to-date departures from average precipitation through today:
Washington National -0.91"/-2.17"/-6.47"
Washington Dulles -0.96"/-3.74"/-3.84"
Baltimore BWI -0.96"/-2.84"/-2.54"
Images (click to enlarge): Maryland and Virginia Drought Monitors as of July 6, 2010 from CPC/NOAA; Precipitation percentage of normal for 30 days ending 8 am EDT, July 8, 2010 from National Weather Service

Wednesday, September 23, 2009

Rare Heavy Dust Storm Brings Red Dawn to Sydney

An unusually strong dust storm brought red skies and extremely low visibility to Sydney, Australia this morning. Although dust storms are fairly frequent in the Australian interior, it's very rare for storms of this intensity to reach the coast. At midday, the heavy dust cloud covered half of the state of New South Wales. The visibility restrictions caused widespread disruption in transportation systems and ferry service was suspended. Long delays occurred at Sydney Airport as Qantas flights were diverted to Brisbane and Melbourne. More than 500 fire alarms were reported between 3 and 7 am as dust particles set off detectors.

Coverage from the Sydney Morning Herald:
Today's forecast for Sydney:
"Strong to gale force west to northwest winds, gradually easing late afternoon or evening. Raised dust clearing, otherwise fine. Cloudy periods."

Image (click to enlarge): Sydney Opera House enveloped in dust, from Sydney Morning Herald

Thursday, August 20, 2009

Mid-Atlantic Drought Update

For more posts on Washington, DC temperature and precipitation, see:
Washington DC Weather Records


After diminishing earlier in the summer, minimal drought has crept back into much of the Washington-Baltimore region. D0 (Abnormally Dry) conditions have jumped this week from 17% to nearly half of the state of Virginia. In Maryland, the D0 area has increased from 48% to 54% of the state.

Through Aug. 20, monthly rainfall at Washington National is less than 50% of average, and seasonal rainfall since June 1 is a little more than 1" in deficit. As of 5 pm today, monthly/seasonal/yearly totals in the area are:
Washington National 0.92"/7.85"/25.12"
Washington Dulles 0.41"/9.28"/29.06"
Baltimore (BWI) 1.52"/10.33"/29.61"
Images (click to enlarge): Maryland and Virginia weekly drought conditions from U.S. Drought Monitor (NOAA/USDA)

Monday, August 17, 2009

Austin's Hottest Summer To Date

For the latest record temperature posts, see:
Record Heat
Record Cold


The extreme summer heat and drought in Texas continue to set records. Through Aug. 16, this is the hottest summer on record in Austin (records since 1854) and San Antonio (since 1885). The averages exceed the previous records by over 1°. Del Rio is having its third hottest summer since 1906. Austin and Del Rio have also had 14 consecutive days of 100° temperatures through yesterday, and San Antonio had 12 consecutive 100°+ days through the 12th. As of 3 pm CDT today, the temperature is 97° in Austin and 98° in both San Antonio and Del Rio. Here are the details from the National Weather Service:
JUNE 1ST TO AUGUST 16TH...2009 WAS THE WARMEST  
JUNE 1ST TO AUGUST 16TH AT AUSTIN MABRY AND SAN ANTONIO...AND
THE 3RD WARMEST AT DEL RIO. JULY 2009 WAS THE WARMEST JULY AND
MONTH FOR AUSTIN MABRY AND SAN ANTONIO. THE TABLE BELOW COMPARES THE
AVERAGE TEMPERATURE FOR JUNE 1ST TO AUGUST 16TH...2009 WITH THE
WARMEST JUNE TO AUGUST PERIODS FROM THE PAST.

AUSTIN MABRY WARMEST JUNE 1ST TO AUGUST 16TH PERIODS FROM
DAILY CLIMATE DATA FROM 1898 TO 2009...A 77 DAY PERIOD

1. 88.4 JUNE 1 TO AUGUST 16...2009
2. 87.2 JUNE 1 TO AUGUST 16...2008
3. 87.0 JUNE 1 TO AUGUST 16...1998

AUSTIN MABRY WARMEST JUNE TO AUGUST PERIODS FROM MONTHLY DATA
FROM 1854 THROUGH 2008.

1. 86.7 JUNE TO AUGUST 1998 AND 2008
2. 86.2 JUNE TO AUGUST 1925 AND 1980
3. 86.1 JUNE TO AUGUST 1923
4. 85.8 JUNE TO AUGUST 1956 AND 2006
5. 85.7 JUNE TO AUGUST 1886...1918 AND 1954

SAN ANTONIO WARMEST JUNE 1ST TO AUGUST 16TH PERIODS FROM
DAILY CLIMATE DATA FROM 1885 TO 2009...A 77 DAY PERIOD

1. 87.9 JUNE 1 TO AUGUST 16...2009
2. 86.7 JUNE 1 TO AUGUST 16...1998
3. 86.6 JUNE 1 TO AUGUST 16...1980

SAN ANTONIO WARMEST JUNE TO AUGUST PERIODS FROM MONTHLY DATA
FROM 1885 THROUGH 2008.

1. 86.2 JUNE TO AUGUST 1980 AND 1994
2. 86.0 JUNE TO AUGUST 1998
3. 85.9 JUNE TO AUGUST 2006
4. 85.6 JUNE TO AUGUST 1962
5. 85.4 JUNE TO AUGUST 1990

DEL RIO WARMEST JUNE 1ST TO AUGUST 16TH PERIODS FROM DAILY CLIMATE
DATA FROM 1906 TO 2009...A 77 DAY PERIOD

1. 89.9 JUNE 1 TO AUGUST 16...1998
2. 89.8 JUNE 1 TO AUGUST 16...1953
3. 88.9 JUNE 1 TO AUGUST 16...2009

DEL RIO WARMEST JUNE TO AUGUST PERIODS FROM MONTHLY DATA FROM 1906
THROUGH 2008

1. 88.7 JUNE TO AUGUST 1998
2. 88.5 JUNE TO AUGUST 1953
3. 88.4 JUNE TO AUGUST 2001
4. 87.8 JUNE TO AUGUST 1951
5. 87.6 JUNE TO AUGUST 1996

AUGUST 16TH WAS THE 14TH 100 DEGREE DAY IN A ROW AT AUSTIN MABRY AND
DEL RIO. FOR THE FIRST 16 DAYS OF AUGUST 2009 SAN ANTONIO HAD 12 100
DEGREE DAYS IN A ROW FROM THE 1ST TO THE 12TH. THE TOTAL 100 DEGREE
DAYS FOR 2009 SO FAR ARE AS FOLLOWS...57 AT AUSTIN MABRY...46 AT
AUSTIN BERGSTROM INTERNATIONAL AIRPORT...54 AT DEL RIO...
50 AT SAN ANTONIO INTERNATIONAL AIRPORT...AND 60 AT SAN ANTONIO
STINSON FIELD.

IN SOME YEARS...NO 100 DEGREE DAYS WERE OBSERVED. IN THE 1970S...
SAN ANTONIO DID NOT HAVE ANY 100 DEGREE DAYS FROM 1972 TO 1977...AND
IN 1979. IN THE 1970S AUSTIN DID NOT REPORT ANY 100 DEGREE DAYS IN
1973...1975 AND 1979...AND DEL RIO HAD NO 100 DEGREE DAYS IN 1976.
IN 2007 DEL RIO AND SAN ANTONIO DID NOT REPORT ANY 100 DEGREE
DAYS...WHILE AT AUSTIN FOR 2007 THERE WERE 3 100 DEGREE DAYS.

SO FAR IN THE SUMMER OF 2009...EXTREME ALL TIME MONTHLY HIGHS
HAVE NOT BEEN OBSERVED YET...HOWEVER A FEW RECORD DAILY HIGHS AND
RECORD DAILY WARMEST EARLY MORNING LOWS HAVE OCCURRED. THE HEAT FOR
THE SUMMER OF 2009 HAS BEEN OF LONG DURATION...NEARLY CONTINUOUS
FROM EARLY JUNE THROUGH AUGUST 16TH. THE DRYNESS ACROSS THE AREA
SINCE SEPTEMBER 2007 HAS CONTRIBUTED TO THE HEAT THIS SUMMER.
IN THE DRY PERIOD 100 YEARS AGO...THE HIGH OF 107 AT SAN ANTONIO
ON AUGUST 20...1909 WAS THE WARMEST ALL-TIME HIGH UNTIL
AUGUST 19...1986 WHEN THE HIGH WAS 108 AND SEPTEMBER 5...2000...WHEN
THE HIGH WAS 111. DURING THE DRY PERIOD IN 1988...DEL RIO HAD AN
ALL-TIME HIGH OF 112 ON JUNE 12...1988...THAT STILL STANDS TODAY.
AT AUSTIN MABRY THE OLD ALL-TIME HIGH OF 109 JULY 26...1954 AND
AUGUST 18...1923 WAS DURING DRY PERIODS...AND WAS LATER EXCEEDED BY
THE HIGH OF 112 SEPTEMBER 5...2000...IN THE LATE AUGUST TO EARLY
SEPTEMBER OF 2000 HEAT WAVE.

THE HOTTEST DAYS THIS YEAR AS OF AUGUST 16TH ARE LISTED BELOW.

LOCATION HOTTEST DAYS AND DATE

AUSTIN MABRY 106 JUNE 25...JUNE 29...AND JULY 8
AUSTIN BERGSTROM 107 JUNE 25
BURNET 103 JULY 8...JULY 9...AND JULY 16
DEL RIO 107 MAY 6
FREDERICKSBURG 101 JUNE 25...JULY 8...AND JULY 9
HONDO 105 JULY 5 AND JULY 8
KERRVILLE 104 JUNE 29...JULY 5...JULY 8...AND JULY 9
LA GRANGE 105 JUNE 25
LLANO 106 JULY 16 AND 26...AUGUST 5...6...AND 11
NEW BRAUNFELS 107 JUNE 25
PLEASANTON 104 JULY 5 AND AUGUST 12
ROCKSPRINGS 100 JULY 8 AND JULY 9
SAN ANTONIO 104 JUNE 29...JULY 5...JULY 8...AND JULY 9
SAN ANTONIO STINSON 107 JULY 5
SAN MARCOS 106 JUNE 25...JUNE 29...AND JULY 5
UVALDE 108 MAY 8 AND JULY 9

JUNE 1ST TO AUGUST 16TH...2009 IS THE DRIEST SUCH PERIOD AT
SAN ANTONIO WITH ONLY 0.97 INCHES OF RAIN...AND THE 10TH DRIEST AT
AUSTIN MABRY WITH 1.62 INCHES OF RAIN. THE SAME PERIOD IS THE 37TH
DRIEST JUNE 1ST TO AUGUST 16TH AT DEL RIO THIS YEAR...WITH 3.24
INCHES OF RAIN. THE TABLE BELOW LISTS THE DRIEST JUNE TO AUGUST
PERIODS FROM THE BEGINNING OF RECORD THROUGH YEAR 2008.

DRIEST JUNE TO AUGUST FROM 1856 TO 2008 AT AUSTIN MABRY

1. 0.92 JUNE TO AUGUST 1910
2. 1.45 JUNE TO AUGUST 1934
3. 1.49 JUNE TO AUGUST 1977
4. 1.50 JUNE TO AUGUST 1884
5. 1.77 JUNE TO AUGUST 1980

DRIEST JUNE TO AUGUST FROM 1871 TO 2008 AT SAN ANTONIO

1. 1.13 JUNE TO AUGUST 1871
2. 1.81 JUNE TO AUGUST 1911
3. 2.00 JUNE TO AUGUST 1938
4. 2.06 JUNE TO AUGUST 1982
5. 2.29 JUNE TO AUGUST 1910

DRIEST JUNE TO AUGUST FROM 1906 TO 2008 AT DEL RIO

1. 0.28 JUNE TO AUGUST 1956
2. 0.48 JUNE TO AUGUST 2001
3. 0.62 JUNE TO AUGUST 1951
4. 0.65 JUNE TO AUGUST 1952
5. 0.75 JUNE TO AUGUST 1989

YEAR TO DATE RAINFALL THROUGH AUGUST 16TH SHOWS JANUARY TO AUGUST
2009 AS ONE THE DRIER JANUARY TO AUGUST PERIODS SO FAR...WITH
ONLY 7.16 INCHES OF RAIN AT DEL RIO...8.02 INCHES OF RAIN AT
SAN ANTONIO...AND 11.48 INCHES OF RAIN AT AUSTIN MABRY. WITH STILL
15 MORE DAYS IN AUGUST THE FIGURES FOR JANUARY TO AUGUST 2009 COULD
CHANGE.

IN THE MEANTIME...THE DRIEST JANUARY TO AUGUST PERIODS THROUGH
YEAR 2008 ARE LISTED BELOW.

AUSTIN MABRY DRIEST JANUARY TO AUGUST PERIODS 1856 TO 2008

1. 7.51 JANUARY TO AUGUST 1925
2. 8.75 JANUARY TO AUGUST 1954
3. 9.59 JANUARY TO AUGUST 1956
4. 10.06 JANUARY TO AUGUST 1984
5. 10.45 JANUARY TO AUGUST 1917
6. 11.91 JANUARY TO AUGUST 1912
7. 12.01 JANUARY TO AUGUST 1879
8. 12.03 JANUARY TO AUGUST 1963
9. 12.10 JANUARY TO AUGUST 1893
10. 12.14 JANUARY TO AUGUST 1875

SAN ANTONIO DRIEST JANUARY TO AUGUST PERIODS 1871 TO 2008

1. 7.16 JANUARY TO AUGUST 1925
2. 7.49 JANUARY TO AUGUST 1917
3. 8.41 JANUARY TO AUGUST 1871
4. 8.98 JANUARY TO AUGUST 1925
5. 9.24 JANUARY TO AUGUST 1910
6. 9.44 JANUARY TO AUGUST 1996
7. 10.23 JANUARY TO AUGUST 1956
8. 10.24 JANUARY TO AUGUST 1953
9. 10.60 JANUARY TO AUGUST 2006
10. 10.69 JANUARY TO AUGUST 1902

DEL RIO DRIEST JANUARY TO AUGUST PERIODS 1906 TO 2008

1. 0.98 JANUARY TO AUGUST 1956
2. 3.10 JANUARY TO AUGUST 1937
3. 3.47 JANUARY TO AUGUST 1933
4. 4.13 JANUARY TO AUGUST 1967
5. 4.33 JANUARY TO AUGUST 1962
6. 4.55 JANUARY TO AUGUST 1951 AND 2001
7. 4.75 JANUARY TO AUGUST 1953
8. 5.69 JANUARY TO AUGUST 1924
9. 5.89 JANUARY TO AUGUST 1989
10. 6.10 JANUARY TO AUGUST 1952

Friday, July 31, 2009

DC Closes Out Dry July


For more posts on Washington, DC temperature and precipitation, see:
Washington DC Weather Records


August 1 Update: This morning's July climate report from the National Weather Service confirms the monthly total of 1.07". If no precipitation falls through Sunday, the entire excess from June will have been wiped out, and the yearly excess will drop to near 1". The monthly percentage of normal precipitation map for the region shows widespread areas of 50% or less from northern Virginia through much of Maryland.

Original post:
With less than an hour remaining in the month, an unofficial 0.13" at Washington National from thunderstorms this afternoon pushes this July into 5th place among driest Julys. This eliminates 1993, with 1.36", from the top ten, and makes 2009 the driest in 10 years, exceeded only by 1.01" in 1999.

Images (click to enlarge): July 2009 percentage of normal precipitation from National Weather Service; CapitalClimate chart from National Weather Service data, photo © Kevin Ambrose

Tuesday, July 28, 2009

Fairbanks Approaches Record For Warm, Dry July

The Fairbanks, Alaska, office of the National Weather Service reported on Monday that this month is well on the way to setting a record for warm temperatures and lack of precipitation. As of noon local time today, the temperature at Fairbanks was already 77°.
JULY OF 2009 IS WELL ON TRACK TO BECOMING THE DRIEST  
JULY ON RECORD...WITH ONLY 0.04 INCHES OF RAIN BEING
RECORDED AT THE FAIRBANKS AIRPORT SO FAR THIS MONTH.
JULY 1927 IS CURRENTLY THE DRIEST JULY ON RECORD
WITH 0.12 INCHES OF RAINFALL.

THIS JULY HAS BEEN NOTABLE FOR THE PERSISTENCE OF
NORMAL TO ABOVE NORMAL TEMPERATURES AND A COMPLETE
ABSENCE OF ANY COOL PERIODS. SO FAR THIS JULY...
THE AVERAGE DAILY MAXIMUM TEMPERATURE HAS BEEN
78.6 DEGREES...THE AVERAGE DAILY MINIMUM 53.7 AND
THE MEAN TEMPERATURE 66.2.

THE AVERAGE DAILY MAXIMUM TEMPERATURE OF 78.6 IS 0.2 DEGREES
ABOVE THE RECORD AVERAGE DAILY MAXIMUM IN JULY OF 78.4 DEGREES
WHICH OCCURRED IN 1915.

EVERY SINGLE DAY SO FAR IN THIS JULY HAS HAD A
MAXIMUM TEMPERATURE OF 70 OR HIGHER. THIS HAS HAPPENED
IN ONLY ONE OTHER YEAR...1927...IN WHICH THE LOWEST
DAILY MAXIMUM TEMPERATURE WAS 70. SO FAR THIS MONTH...
THE LOWEST DAILY MAXIMUM TEMPERATURE HAS BEEN 71.
HIGH TEMPERATURES NEAR 80 OR HIGHER ARE EXPECTED
AT FAIRBANKS FOR THE NEXT 3 DAYS...AND THE HIGH
FRIDAY IS EXPECTED TO BE NEAR 75. SO THERE IS A GOOD
CHANCE THAT THE AVERAGE DAILY MAXIMUM TEMPERATURE FOR
THIS MONTH WILL BREAK THE OLD RECORD.

Seasonal Outlook

Latest seasonal forecast: Click here.


Latest 3-month temperature outlook from Climate Prediction Center/NWS/NOAA.