Showing posts with label Seasonal Forecast. Show all posts

Sunday, June 3, 2012

Preliminary Data Continue Supporting US Record Warm Spring Estimate

June 7, PM Update: See update for official report from NOAA/NCDC.

June 5, PM Update: Preliminary National Climatic Data Center analysis, based on National Weather Service data, shows an average May temperature departure from normal of only 2.33°F. This would reduce the U.S. spring average about 0.7° from the earlier estimate. However, the adjusted average would still exceed the old record by a wide margin:


June 4, PM Update: Using a larger subset of 237 National Weather Service stations for May 1-31, the average is 3.5°F above the 1981-2012 climatology, so it's very likely that the May average was within 0.1°C of being 2°C above climatology.

Original post:
Now that preliminary data are available through the end of May, earlier estimates of U.S. record warm spring temperatures are being further confirmed. For the meteorological spring months of March through May, temperatures averaged above climatology in nearly the entire country, except for the immediate Pacific Coast:
Much of the Midwest was 3.5°C or more above average, with most or all of 5 states above 4°C.

Looking at the averages from 215 official National Weather Service reporting stations for the weeks ending from May 6 through June 3, the U.S. May temperature would average 3.7°F above the 1981-2010 climatological baseline:


This puts the May 2012 national average temperature at 65.5°, which edges out the record warmest May of 1934 by 0.1°.

Combined with the significantly above-average temperatures of March and April, it's very likely that the final spring temperature will exceed the previous warmest spring of 1910 by as much as 2.4°F. Five of the top 8 warmest springs will now have occurred in the 13 years of this century.


Official U.S. temperature averages will be published by the NOAA National Climatic Data Center in about a week.

Wednesday, November 24, 2010

One More 2010-11 Winter Weather Outlook (Topper Shutt/Howard Bernstein)

See here for other seasonal forecasts.

WUSA-TV (Channel 9) meteorologists Topper Shutt and Howard Bernstein have joined the La Niña bandwagon with their winter weather outlook this evening (warmer than average and less than average snowfall).

In living color:

Tuesday, November 23, 2010

Yet Another Winter 2010-11 Outlook (Doug Hill)

See here for other seasonal forecasts.

Doug Hill's (WJLA-TV, Channel 7) 2010-11 Washington/Maryland/Virginia winter outlook also calls for a La Niña pattern of warmer than average temperatures and lower than average snowfall:
Hill predicts the metro area will see 12 inches to 14 inches of snow, while Southern Maryland sees 10 inches and the mountains of Western Maryland, 25.
Here's the video (audio volume is low):

Another 2010-11 Winter Weather Outlook:
"Brutal Winter?" Kammerer Says No

See here for other seasonal forecasts.

WRC-TV (NBC 4) Chief Meteorologist Doug Kammerer issues his first Washington DC winter outlook, posted tonight. He calls for temperatures to be at least 2° above average each month and snowfall significantly below average, 8-14".

View more news videos at: http://www.nbcwashington.com/video.

Wednesday, November 10, 2010

Mid-Atlantic 2010-2011 Winter Outlooks

As noted earlier, NOAA's Climate Prediction Center expects the 2010-11 U.S. winter to be dominated by a strengthening La Niña sea surface temperature pattern in the equatorial Pacific. For the Mid Atlantic region, this implies nearly equal chances of above or below average temperatures and precipitation.

The National Weather Service (NWS) has analyzed the temperature and precipitation for December-January-February (DJF) in years since 1950 with La Niña conditions. They find that there is a statistical correlation between the strength of La Niña and Washington/Baltimore area temperatures: Weak La Niña years have slightly below-average temperatures, while moderate years are slightly above average, and strong years are more above average.

Winter precipitation in La Niña years on average is below normal by about 10%. This is true pretty much independently of the strength of the La Niña. For snowfall, however, weak La Niña years average above the long-term mean, but moderate and strong years have below-average amounts. This is especially true for the main snowfall months of January and February. The NWS concludes that this is the result of the more westerly storm tracks and warmer temperatures which are associated with the stronger La Niñas: "More storms tracking to the west of the Appalachians would imply the mid-Atlantic region being located on the warmer side of storms, resulting in more mixed or rain events for the area and less snow events."

Washington and Baltimore have each had only two double-digit snowstorms in La Niña winters since 1950:
Dates              Washington Baltimore
6–8 January 1996 17.1" 22.5"
16–17 December 1973 10.2" 7.7"
25 January 2000 9.3" 14.9"
Images (click to enlarge): Washington, DC winter average temperature, precipitation, and snowfall for average, weak, moderate, and strong La Niñas, from National Weather Service, Sterling, VA

Another winter 2010-11 Washington winter outlook, from Bob Ryan, WJLA-TV (Channel 7):

Thursday, October 21, 2010

NOAA 2010-2011 Winter Outlook: Strong La Niña Bringing More Extremes;
Above Average Temperatures Over Much of Country

The winter weather outlook (December 2010-February 2011) released this morning by NOAA's Climate Prediction Center is dominated by the effects of a developing strong La Niña. Temperatures are forecast to be above the long-term average from the Ohio Valley through most of the Southeast and westward to the Rockies. The warmest area relative to average is predicted from southern New Mexico eastward through most of Texas and Louisiana.

The only areas expected to be cooler than average are along the immediate Pacific Coast and eastward along the Canadian border to northern Minnesota. There are equal chances of above or below normal temperatures in the interior of the West and across the Great Lakes, Mid Atlantic, Northeast, and southern Florida.

Precipitation is predicted to be above average in the eastern Great Lakes, Ohio and mid-Mississippi Valleys, and from the Pacific Northwest and northern California eastward across the northern Rockies. The wettest areas relative to average are likely to be the Pacific Northwest, northern Rockies, and lower Ohio Valley.

Drier-than-average conditions are forecast along the southern tier of states from the Southwest eastward across the Gulf Coast to the Southeast, with the driest conditions through central and northern Florida. The National Weather Service chart of West Palm Beach precipitation, to the right, shows the drastic reduction of dry season rainfall during past moderate to strong La Niña patterns. The red bars represent the precipitation deficit, and the green bar represents the climatological precipitation total.

Equal chances of above or below average precipitation are expected from central and southern California eastward across the central Rockies and much of the Great Plains, as well as from the central Appalachians northeastward through the Mid Atlantic and Northeast.

The seasonal drought outlook for the next 3 months (November-January) calls for persistence or intensification of drought conditions in the Southeast, but with improvement of conditions in more northern areas, particularly the lower Ohio Valley and Mid Atlantic.

La Niña is defined by cooler than average sea surface temperatures in the equatorial Pacific Ocean. The current La Niña continued to develop during September, and the latest outlook calls for it to strengthen into the winter and continue through at least the spring.

For the DMV (DC, Maryland, and Virginia), there are equal chances of above or below temperature and precipitation. Average temperature, precipitation, and snowfall for Washington in the winter are:
        Temperature Precipitation Snowfall
December 39.5 3.05" 1.5"
January 34.9 3.21" 6.2"
February 38.1 2.63" 5.2"
Winter 37.5 8.89" 15.2" (Nov-Mar)
For some caveats on the forecast, see The Weather Channel's analysis: NOAA Issues Winter Outlook

Images (click to enlarge), from Climate Prediction Center/NOAA and National Weather Service:
  • U.S. winter 2010-11 temperature outlook
  • U.S. winter 2010-11 precipitation outlook
  • Historical West Palm Beach La Niña precipitation amounts
  • November-January U.S. drought outlook
  • Typical North American La Niña jet stream and weather patterns
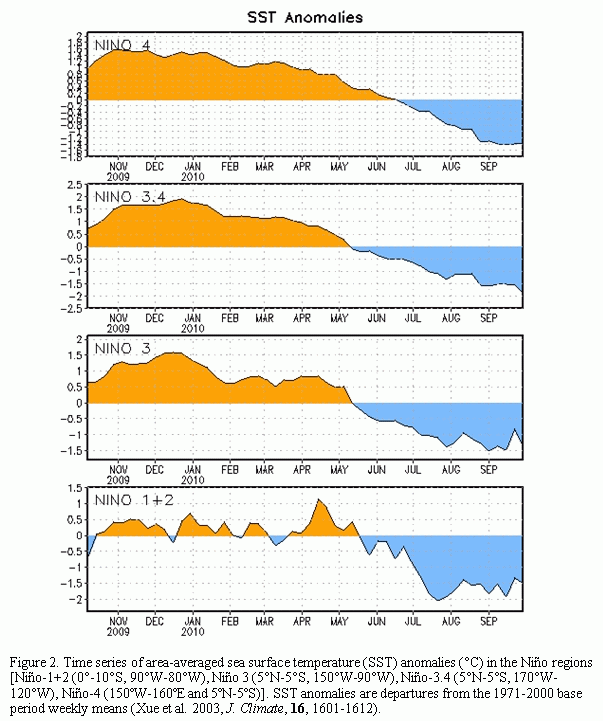
  • Weekly equatorial Pacific sea surface temperatures, Oct. 2009-Sept. 2010

Tuesday, September 21, 2010

Seasonal Weather Outlook Update: Warm Fall, Then Colder Early Winter in Northeast

WSI, the industrial weather forecasting subsidiary of The Weather Channel, announced exclusively on CNBC this morning (video unavailable) that its updated seasonal weather outlook calls for a warm remainder of the fall over much of the northern U.S. followed by colder weather in December:
"The combination of the La Nina event, a relatively cold north Pacific, and a record warm north Atlantic are quite bullish for a very warm October, especially across the northeastern quarter of the country" said WSI Chief Meteorologist Dr. Todd Crawford. However, the historically persistent negative phase of the North Atlantic Oscillation and the strength of the North Pacific climate signals suggest that the widespread warmth in October will be short-lived with more widespread cold across the eastern US in November and December. For the October-December period as a whole, we are forecasting 1776 gas-weighted heating degree days, within 1-2% of both last year and the 1971-2000 mean."
The latest 90-day outlook for October-December 2010 from NOAA's Climate Prediction Center, shown in the image, calls for more widespread warmth, especially over the central and southwestern portions of the country.

Friday, August 27, 2010

Pre-Season Preview: Preliminary 2010-2011 Winter Outlook

There are still a few more days to summer, but preliminary winter outlooks are already being issued. Bloomberg reports that Rockville, MD based MDA Federal is forecasting a relatively warm winter for the U.S., the warmest in 5 years. The prediction for 2,515 heating degree days in the U.S. is slightly less than the 10-year average of 2,577 and considerably below the 2,767 last winter.

The temperature forecast calls for temperatures in New York to be 2.5° above the 30-year average and in Chicago 2° above.

The latest 3-month outlook for December through February from NOAA's Climate Prediction Center also shows near to above normal temperatures for most of the country.

Expectations of lower demand for the winter have done little to support natural gas prices, which have dropped 31% so far this year.

Wednesday, December 2, 2009

More Winter Weather Outlooks

See here for other seasonal forecasts, including the current winter energy forecast.

Bob Ryan and his colleagues Veronica Johnson, Tom Kierein, and Chuck Bell at WRC-TV, Channel 4, give their 2009-2010 winter outlooks for Washington, DC. Bob's forecast: colder and snowier than average.

View more news videos at: http://www.nbcwashington.com/video.


Howard Bernstein, Kim Martucci, and Topper Shutt at WUSA-9 are predicting near-average temperatures and above-average snowfall.

Monday, November 16, 2009

Winter 2009-2010 Outlook Update: Local TV Forecasts

NOAA's 2009-2010 winter outlook was issued October 15. Here are some local TV weather outlooks:

Monday, November 2, 2009

El Niño Continues to Strengthen

Nov. 5 Update: The monthly El Niño Diagnostic Discussion, issued this morning, confirms the strengthening trend:
During October 2009, sea surface temperature (SST) anomalies increased across the central and eastern equatorial Pacific Ocean (Fig. 1 & Fig. 2). The Niño-3.4 index increased nearly a degree with the most recent weekly value at +1.5°C (Fig. 2). Above-average subsurface temperature anomalies increased across a large region of the central and east-central Pacific, with anomalies ranging between +1 to +5°C by the end of the month (Fig. 3).

Original post (Nov. 2):
The latest weekly El Niño update, released today, shows sea-surface temperatures continuing to increase in all 4 of the El Niño regions in the tropical Pacific. Temperatures are at least 1°C above average in most of the central and east-central equatorial Pacific. Model forecasts indicate that El Niño conditions will continue to strengthen and last through the 2009-2010 winter.

See here for the winter outlook.

The latest El Niño regional temperature departures from average are:
Niño 4   1.6ºC
Niño 3.4 1.5ºC
Niño 3 1.2ºC
Niño1+2 0.4ºC
Image (click to enlarge): 2008-2009 El Niño regional sea-surface temperatures from NOAA/Climate Prediction Center

Thursday, October 15, 2009

NOAA's 2009-2010 Winter Outlook: El Nino Rules

See here for other seasonal forecasts, including the current winter energy forecast.

In honor of Blog Action Day, here's a view of an effect which has a shorter time scale than climate, seasonal weather:

NOAA's Climate Prediction Center this morning issued its outlook for winter 2009-10 (December-January-February) in the U.S. It calls for a strengthening El Niño in the central and eastern tropical Pacific to dominate weather patterns for much of the country. The relatively warm Pacific water temperatures are expected to affect tropical rainfall distribution and in turn influence the strength and location of the storm track over North America.

The temperature forecast includes warmer than average temperatures over much of the West and central and northern Midwest. The best chance (over 40%) of warmer-than-average temperatures is from the northern Rockies eastward to Minnesota and as far south as Colorado and Nebraska. Temperatures are expected to be cooler than average from southern Texas northeastward to the Mid Atlantic area, including the Southeast. The Washington, DC region is on the borderline between the areas for over 33% chance (Maryland) and over 40% chance (most of Virginia) of cooler than average temperatures. The highest probability (over 40%) of cool temperatures is in the Southeast, from Virginia southward to Florida and westward along the Gulf Coast.

Precipitation is expected to be heavier than average along the central and southern West Coast eastward along the southern border and Gulf Coast through Florida. The wettest areas are likely to be most of California, central and southern Texas, and Florida. The driest areas relative to average are predicted to be the Pacific Northwest eastward across the northern Rockies and also from the northern Gulf States northeastward through the Ohio and Tennessee Valleys to the eastern Great Lakes.

Unlike the hype-casts promoted by certain commercial forecast services and media, the NOAA forecast recognizes the futility of predicting snowfall at seasonal time scales:
This seasonal outlook does not predict where and when snowstorms may hit or total seasonal snowfall accumulations. Snow forecasts are dependent upon winter storms, which are generally not predictable more than several days in advance.
Images (click to enlarge): U.S. winter 2009-2010 temperature and precipitation outlook and most recent Pacific sea-surface temperature (SST) departures from average, from Climate Prediction Center/NOAA

Tuesday, October 6, 2009

Energy Agency Issues 2009-2010 Winter Forecast

See here for other seasonal forecasts, including the current NOAA winter forecast.

The federal government's Energy Information Agency (EIA) today issued its winter forecast (Oct. 1, 2009 to March 31, 2010). The outlook calls for a national average decrease in home heating expenses of 8% from last year. The decrease is mainly the result of lower fuel prices, but milder temperatures are also a factor. The largest reductions are for households using natural gas (down 12%) and propane (down 14%). Costs for electricity and heating oil are projected to decline by 2%.

NOAA's latest experimental monthly degree day forecast shows that the contiguous 48 states are likely to be 1% warmer than average. Degree day predictions vary between regions, with the Midwest forecast to be 4% warmer and the West 4% colder. New England and the Mid Atlantic regions are forecast to be near normal. The South Atlantic area, which includes DC, Maryland, and Virginia southward through the Carolinas to Florida, is predicted to be 2-3% colder on average. Maryland and Virginia, however, are each expected to be within 1 heating degree day of normal per month.

Image (click to enlarge): Monthly degree days 2009-10 vs. 2008-09, from NOAA via EIA; U.S. monthly residential natural gas price, CapitalClimate chart from EIA data

Thursday, August 6, 2009

Hurricane Season Outlook Revised Lower

NOAA this morning revised its Atlantic tropical season outlook downward from the forecast released in May. The new prediction from the Climate Prediction Center and National Hurricane Center calls for the following probabilities (May numbers in parentheses):
Above normal: 10% (25%) 
Near normal: 50% (50%)
Below normal: 40% (25%)
There is a 70% chance of the following numbers of storms (normal in parentheses):
Named storms:     7-11 (11)
Hurricanes: 3-6 (6)
Major hurricanes: 1-2 (2)
The intensity of the hurricane season is measured using the Accumulated Cyclone Energy (ACE), which is a combination of the duration and intensity of storms, rather than simply the number of storms.

The downward revision in the forecast is based mainly on the continued development of El Niño conditions in the tropical Pacific. The higher wind shear (increase of wind with height) from El Niño is expected to outweigh the effects of warmer than average Atlantic and Caribbean sea surface temperatures.

Despite the indications of lower than average tropical activity, NOAA cautions residents of the Atlantic and Gulf Coasts that they should be prepared every year, regardless of the overall level of activity. To paraphrase on old mariners' saying, "One nasty hurricane can spoil your whole day." Some examples of hurricane landfalls in El Niño years include Betsy (1965), Bob (1991), Danny (1997), and Lili (2002). The most notorious example of a disastrous storm during a below-average season was Andrew (1992). Others include Hurricane Donna (1960) and Hurricane Betsy (1965).

The latest dates for the first storm of the season are:
For records back to 1851:
Tropical storm: September 15 (1914)
Hurricane: October 8 (1905)

Satellite era (since 1966):
Tropical storm: August 30 (Arlene, 1967)
Hurricane: September 11 (Gustav, 2002)

Image (click to enlarge): Recent sea surface temperatures, from NOAA/Climate Prediction Center

Thursday, July 9, 2009

Early El Niño Emerges
Further Development Expected

NOAA's Climate Prediction Center released its monthly El Niño diagnostic discussion this morning. It reports that El Niño conditions have now developed in the Pacific:
During June 2009, conditions across the equatorial Pacific Ocean transitioned from ENSO-neutral to El Niño conditions. Sea surface temperature (SST) anomalies continued to increase, with the latest weekly departures exceeding +1.0°C along a narrow band in the eastern equatorial Pacific.
Sea surface temperatures have steadily increased across all of the monitored regions.

Model forecasts indicate a consensus for further development of El Niño conditions, although there is a range of indications for the maximum intensity. Current conditions and trends imply a "weak-to-moderate strength El Niño into the Northern Hemisphere Fall 2009" and possible further strengthening into the winter.

El Niño usually has weak impacts on the U.S. during summer and fall, but there is some tendency to suppress Atlantic hurricane activity because of increased wind shear. On the other hand, a recently published study shows that the effect on hurricane development may depend on whether the maximum temperature effects occur in the eastern or central Pacific. In years with eastern Pacific maximum warmth, tropical cyclone activity seems to be lower. So far, at least, the current pattern appears to be the eastern Pacific variety. NOAA's hurricane season forecast will be updated along with the next El Niño analysis on August 6.

By increasing the strength of the southern branch of the jet stream, El Niño tends to favor increased winter storminess on the U.S. Pacific Coast, more rainfall in the Southwest, and less wintry weather in the northern portion of the country. As a transitional zone, the Mid Atlantic region can be affected both positively and negatively in the winter depending on the particular pattern of strength and evolution of the El Niño conditions.

Images (click to enlarge): Latest equatorial Pacific sea-surface temperature (SST) departures from average, El Niño region SST history, El Niño model forecasts, all from NOAA/Climate Prediction Center

Thursday, May 21, 2009

NOAA Issues 2009 Hurricane Outlook:
Near Average in Atlantic, Near to Below in Eastern Pacific

PM Update: Natural gas prices finished the day down over 9%.

Original post:
NOAA this morning issued the initial 2009 hurricane season outlook. The forecast calls for near average storm activity in the Atlantic and near to below average in the eastern Pacific. For the Atlantic, the probability is 50% for near average and 25% each for above or below average. In terms of number of storms, this represents a 70% chance for 9 to 14 named storms, 4 to 7 of which could become hurricanes, including 1 to 3 major storms. According to NOAA's Climate Prediction Center, the seasonal outlook is influenced by several conflicting climate effects:
Supporting more activity this season are conditions associated with the ongoing high-activity era that began in 1995, which include enhanced rainfall over West Africa, warmer Atlantic waters and reduced wind shear. But activity could be reduced if El Nino develops in the equatorial Eastern Pacific this summer or if ocean temperatures in the eastern tropical Atlantic remain cooler than normal.
In the eastern Pacific, the outlook expects an 80% chance of a near to below normal season. There is a 70% chance of storm activity in the range of: 13- 18 named storms, 6- 10 hurricanes, 2- 5 major hurricanes.

Image (click to enlarge): 2009 hurricane season outlook from NOAA

With oil up 35% year to date to a 6-month high, CNBC earlier today explored the influence of the storm season and other factors on the price of oil going forward (video below). In the short term, the better than expected hurricane forecast, higher than normal inventories, a falling dollar in the face of over $100 billion in Treasury debt to be issued next week, and a dropping stock market are being credited for a decline in natural gas prices of as much as 8% today.


Wednesday, February 25, 2009

Cool Spring Forecast for UK, Western Europe
Coldest Winter in a Decade

Here's another spring forecast, this one issued today by the Met Office for the UK and western Europe.

Temperature:
For the UK and western Europe spring this year is likely to be cooler than last year, with mean temperatures either near or below average.

In contrast, mean temperatures are likely to be near average or above average over much of eastern Europe.
Precipitation:
For the UK and much of northern Europe precipitation is likely to be average or below average.

In contrast, average or above-average rainfall is likely over southern Europe and the central Mediterranean.
UK average temperature March–May from 1971–2000 is 7.4°C. Average precipitation is 231.7 mm.

The spring forecast will be updated on March 25, and the first summer outlook will be issued on March 31.

The Met Office also announced today that provisional figures show this to be the coldest UK winter since 1995/96.

Thursday, February 19, 2009

Seasonal Update: Near-Average Spring 2009 Forecast for U.S.

Images (click to enlarge): Spring (March-April-May) 2009 temperature and precipitation forecasts, 90-day average temperatures and departures ending Feb. 17, from Climate Prediction Center.

The seasonal forecast for meteorological spring (March-April-May) 2009 was issued today by the NOAA/NWS Climate Prediction Center. Equal chances of above, near, or below average temperatures are expected across most of the country. The exceptions are the Southwest through the western Gulf Coast, where chances of warmer than average temperatures are up to 50%, and the Pacific Northwest, where cooler than average readings are forecast. States with primarily warm temperatures predicted are: Utah, Colorado, Arizona, New Mexico, Texas, and Oklahoma. Cool temperatures are predicted for the state of Washington, most of Oregon, and northern Idaho.

Precipitation is also expected to be near average over a large area, with drier conditions predicted from the Southwest through the Gulf Coast and Southeast.

Meanwhile, with 10 days left in winter, temperatures for the last 90 days have been running warmer than average over most of the Southeast and nearly all of the western half of the U.S. Cooler than average temperatures have prevailed over New England, the Mid Atlantic, and the Midwest, as well as central and southern Florida and the extreme Pacific Northwest.

Thursday, December 18, 2008

Inauguration Weather Update: Chances Improve for Mild January


The official January 2009 weather outlook, released today by NOAA's Climate Prediction Center, indicates at least an equal chance of above average temperatures for the entire contiguous 48 states of the U.S. For the Mid Atlantic region, including the Washington, DC, area, chances are 33-40% for above-average temperatures for the month. While it's still too early for a specific January 20 forecast, the likelihood of a mild Inauguration Day has improved.


Except for the immediate Ohio Valley region, where above-average precipitation is forecast, and the extreme Southeast with below-average rainfall expectations, there is an equal chance of above, normal, or below average precipitation for the month in most of the country. The area of equal chances includes the Washington, DC, area.

Images: January 2009 temperature and precipitation forecasts from NOAA, Climate Prediction Center. Click an image to enlarge.

For earlier inauguration weather posts, see the following:

Monday, December 1, 2008

Even More 2008-2009 Winter Weather Outlooks

WSI Corp., a sister company to The Weather Channel and operator of Intellicast, has updated its winter weather outlook for 2008-2009. It calls for a cold December, but a warm January, in the eastern U.S. The Northeast is expected to be colder than normal, and the Southeast warmer than normal, in February:
The current cold pattern in the northeastern US should persist through at least the first half of December. A temporary transition to a mild pattern should occur from January into early February, before the pattern reverts back to a much colder regime during the last weeks of winter.
Larry Cosgrove's WEATHERAmerica is forecasting a "very wintry Midwest and Eastern Seaboard", including the "possibility of major ice storm formation around Appalachia and the Piedmont (including the markets of Birmingham AL; Atlanta GA; Charlotte NC; Raleigh NC; and Richmond VA)."

Click here for previous winter outlook posts.

Images: Predicted storm tracks and snowfall potential for winter 2008-2009 from WEATHERAmerica.

Seasonal Outlook

Latest seasonal forecast: Click here.


Latest 3-month temperature outlook from Climate Prediction Center/NWS/NOAA.