Showing posts with label Heavy Rainfall. Show all posts

Thursday, July 18, 2013

San Juan Swamps Century-Plus Rainfall Record


Image (click to enlarge): Puerto Rico 24-hour precipitation ending 8 am EDT, July 19, 2013, from National Weather Service

Midnight Update: The final daily rainfall for San Juan is 9.23", the second highest for any day on record.

The year-to-date rainfall total is now 185% of normal and only about 8" below the normal for the entire year. If San Juan were to tie the record low rainfall for each of the remaining 5 months in the year, it would still finish 2013 less than 1" below normal.

5 PM Update: It's baaack! With 0.67" more in this hour, the total of 9.11" is now the second highest for any day in San Juan history and a little more than half an inch from the top spot. Moderate rain continues.

4 PM Update: Rain ended with only 0.02" in the past hour, but less than half an inch in the rest of the day would make second place on San Juan's all-time daily record list. The NWS reports that more is on the way.

The monthly total of 11.64" also breaks the old July record of 11.08" just 2 years ago.

3 PM Update: Another 1.91" in the past hour brings the San Juan daily rainfall total to 8.42", which is the second highest for any summer day and the 4th highest of all time.

2 PM Update: With light rain continuing to fall, the daily total so far is now 6.51", which is the 10th highest for any day in any month. The previous top 10 San Juan daily rainfall amounts:
15-Aug 9.67 in 1944
18-Sep 8.84 in 1989
14-Dec 8.84 in 1910
10-Sep 8.20 in 1996
11-Nov 7.92 in 1931
13-Sep 7.39 in 1928
15-Apr 7.10 in 1988
25-Nov 7.07 in 1979
12-Dec 6.96 in 1981
7-Apr 6.19 in 1915 
Original Post:
Puerto Rico should get a lot of heavy downpours in the summer with tropical cyclones, right? Well, with no organized tropical system whatever, San Juan has just smashed its all-time July daily rainfall record. The National Weather Service reports that the 4.92" so far today has exceeded by a wide margin the old record for July 18 of 3.19", set in 1950. As of that report, heavy rain was still falling.

Today's amount is also well above the old daily record for July of 4.04" on July 7, 1901. It's only the 5th time July daily precipitation has exceeded 3" in a climate history which began in 1898.

The previous top 5 July daily rainfall amounts for San Juan, from the National Climatic Data Center:
7-Jul 4.04 in 1901
23-Jul 3.66 in 1926
18-Jul 3.19 in 1950
12-Jul 3.01 in 1905
24-Jul 3.00 in 1949 

Friday, July 12, 2013

Record Rainfall Drenches Dulles;
Update: Rain Ransacks Roanoke Record


Images (click to enlarge): Washington, DC regional radar, 12:49 am EDT, July 12, 2013, from The Weather Channel; 24-hour precipitation ending 8 am EDT, July 13, 2013, for Washington region, from National Weather Service

2 PM EDT Update: The 3.88" a day earlier (July 10) at Roanoke smashed the daily record of 2.67" in 1931. It was also a new all-time July daily record in a climate history which began over a century ago in 1912. Daily amounts of 3" or more had been observed only twice before in July at Roanoke.

The 1.84" at Richmond also broke a July 10 record of 1.36" set just last year.

To the north, the 2.44" at Pittsburgh beat the daily record of 1.81" in 1958.

10 AM EDT Update: The preliminary July 11 record daily total rainfall for Dulles is 3.71". The 24-hour total ending at 8 am is 4.49", with some light rain continuing.

2 AM EDT Update: Dulles has added 0.22" from lighter thundershowers in the past hour for a storm total so far of 3.79". The reported month-to-date total is now 370% of normal.

Original Post:
Persistent thunderstorms Thursday evening have produced record rainfall in the Virginia suburbs of Washington, DC. At Dulles Airport, the unofficial total of 3.61" through midnight (standard time) was over 3 times the old record for July 11 of 1.12" in 1977. Climate records at Dulles date back only a half-century to 1962, but this was also enough to beat the all-time July daily record of 3.50" on July 27, 1994.

The official climate record for Washington, DC, which began in 1871, shows that July daily rainfalls of 4" or more have occurred on at least 3 occasions:
4.69", July 9, 1970
4.35", July 22, 1969
4.25", July 30, 1878

Friday, June 7, 2013

Andrea Smashes Early-Season Rainfall Records

June 8, 10 AM Update: Added Salisbury, Wilmington, Allentown, Islip, Massena, Boston, Providence. Updated totals through midnight.

10 PM EDT Update: Added Richmond, New Bern, Hartford, Bridgeport, Worcester. Updated totals through 8 pm (10 pm for CT and MA).

Original post:
Heavy rainfall associated with the pre-storm environment and Tropical Storm Andrea itself has been smashing daily rainfall records along the East Coast. At Raleigh-Durham, North Carolina, the unofficial total of 5.14" is the highest so early in the season and the second highest for any day in June for climate records dating back to 1887. Based on National Weather Service preliminary record reports, daily climate reports, and hourly precipitation data, here are the records so far (all for June 7 unless otherwise noted). The rain is continuing in most locations.

Location Record Previous Date
NC Fayetteville 2.36 1.78 1930
Raleigh/Durham 5.14 1.24 1930
New Bern 1.51 1.20 2003
VA Lynchburg 3.38 3.31 1989 6-Jun
Roanoke 1.77 1.15 1934 6-Jun
Blacksburg 2.70 1.09 1961 6-Jun
Richmond 2.67 1.68 1913
MD Salisbury 1.58 1.43 1913
DE Wilmington 3.36 1.78 1916
NJ Newark 3.71 1.11 1931
Trenton 3.51 1.60 1989
PA Philadelphia 3.50 1.79 1904
Allentown 1.82 1.19 1948
NY Kennedy Airport 4.01 1.18 2006
LaGuardia Airport 3.33 1.08 2006
Islip 4.15 1.27 2006
Syracuse 2.39 1.20 2010 6-Jun
NYC/Central Park 4.16 1.95 1918
Massena 0.72 0.43 1984
CT Hartford 2.53 1.54 1913
Bridgeport 4.43 1.36 2006
MA Worcester 2.68 1.75 2006
Boston 3.07 2.89 2006
RI Providence 3.23 3.08 2006

Thursday, November 29, 2012

Record Northern Pacific Coast Rainfall

Image (click to enlarge): Northern California precipitation for 24 hours ending at 5 am PST, November 30, 2012, from National Weather Service

November 30 Update: Crescent City peaked out at 4.14" of rain yesterday, more than doubling the old record. Ukiah almost doubled its old record with 2.48", vs. 1.42" in 1938.

Other record reports from the National Weather Service:
A RECORD RAINFALL OF 2.22 INCH(ES) WAS SET AT MEDFORD OR YESTERDAY.   
THIS BREAKS THE OLD RECORD OF 1.25 SET IN 1917.  

A RECORD RAINFALL OF 1.6 INCH(ES) WAS SET AT ROSEBURG OR YESTERDAY.   
THIS BREAKS THE OLD RECORD OF 1.43 SET IN 1951.  
Original post:
The heavy rains pounding the Pacific Coast have already set daily records at several locations in northern California and Oregon as of early this evening. The National Weather Service reports:
..RECORD RAINFALL SET AT CRESCENT CITY CA  
A RECORD RAINFALL AMOUNT OF 2.50 INCHES HAS FALLEN SO FAR TODAY.   
THIS BREAKS THE PREVIOUS RECORD AMOUNT OF 2.00 INCHES SET IN 1995.  
Since that report was issued at 4 pm local time, over one and a half inches of additional rain has been unofficially reported. Crescent City climate records began in 1894.

At Mt. Shasta, the 1.69" as of 4 pm was closing in on the record of 1.81" from 1932, and since then at least three-quarters of an inch of additional rain has fallen.

In Oregon, Medford's 1.58" as of 4 pm was enough to break the record of 1.25" from 1917.


Thursday, November 8, 2012

Sandy Precipitation Update: Maryland in Bullseye


Preliminary analysis from the National Climatic Data Center for the precipitation totals from Superstorm Sandy shows that Maryland was in the bullseye. Nearly all of the area of highest rainfall (greater than 5.3") was within the state, with small areas extending into northern Virginia and extreme southwestern Delaware. The highest amounts reported from first-order National Weather Service stations:
Wallops Island WSSF, VA         8.48
Atlantic City, NJ               8.03
Cape Hatteras AP, NC            7.85
Salisbury AP, MD                7.55
Norfolk South, VA               7.33
Baltimore Washington AP, MD     6.83
Atlantic City AP, NJ            6.00
Mount Washington, NH            5.70
Washington Dulles AP, VA        5.65
Washington Reagan AP, VA        4.84  

Thursday, August 16, 2012

Tropical Rainfall Rate in Arctic Alaska


From the National Weather Service in Alaska:
Roughly one third of the annual precipitation has fallen in Northwest Alaska over the past 4 days! 3.5 inches of rain at Kivalina, 2.5 inches at Kotzebue and 5 inches at Red Dog Mine, a region where rainfall in excess of 3 inches over 3 days is a once-in-a-hundred-year event.

The Wulik River below Tutak Creek crested at 6 A.M. this morning with a river level of 15.31 feet. This was the highest stage ever observed since the gauge was installed in 1985, and far exceeds the previous record of 12.21 feet set in August of 1994. Water levels in the area will remain high as additional rainfall of 1 to 3 inches is expected in the next 48 hours. Water levels are also high in the village of Noatak.

The system is moving east, and rises are expected on the Kobuk River, although the Kobuk near Kiana remains well below flood stage.

Many of the rivers in this area do not have gauges, but based on rainfall there is significant potential for widespread flooding.

Sunday, June 10, 2012

Over 1 Foot of Non-Tropical Rainfall Smashes 99-Year Pensacola Record by Nearly 7 X

Image (click to enlarge): 24-hour precipitation ending at 7 am CDT, June 10, 2012 in the Mobile-Pensacola region, from National Weather Service

5 PM CDT Update: Rainfall has gradually tapered off this afternoon at Pensacola, but the daily total is up to 1.92".

Original post:
Excessive rainfall from a nearly stationary non-tropical storm crushed the daily precipitation record at Pensacola, Florida on June 9 (Saturday). The 13.13" of rain drowned the old record of 1.95" set in 1913 by a factor of 6.7 to 1. It was also the second highest all-time daily rainfall amount, exceeded only by the 15.29" from a tropical storm on October 5, 1934. The previous all-time June daily record was 10.10" on the 29th in 1887.

Over 1" fell in each of 5 consecutive hours and in 7 out of 8 consecutive hours. The largest amount was 3.17" (over 1" more than the previous daily record) in the hour ending at noon. An additional 1.51" of rain had already been recorded by 1 pm CDT today. The record for June 10 is 2.81" in 1968. Pensacola climate records began in 1879.

The 5.79" at Mobile, Alabama also smashed the June 9 record, which was 1.39" in 1968.

This schematic map from the National Weather Service shows a slow-moving upper-level low pressure area and a stationary front along the Gulf Coast (click to enlarge):


Contrast the current situation with the track of the October 1-6, 1934 tropical storm, from NOAA (click to enlarge):

Tuesday, February 7, 2012

Out-of-Season Downpour in Key West Sets New All-Time February Daily Rainfall Record;
9th Wettest February in 1 Day


The National Weather Service reports that the 4.34" of rainfall at Key West, Florida on February 5 is a new all-time daily rainfall record for the month of February. It also put this month into the position of 9th wettest February in climate records extending back to 1871. The 0.22" of precipitation as of 4 pm today moves the month up to 8th place, barely behind the 4.63" just 2 years ago.

The wettest February at Key West was in 1872, when 7.19" was recorded. Three of the wettest Februaries at Key West have now occurred in the last 15 years (1998, 2010, and 2012).

Key West also set a daily precipitation record by a wide margin on October 17, when the 6.91" smashed the previous record of 4.08" in 1910.

From the National Weather Service:
RAINFALL ON SUNDAY FEBRUARY 5TH TOTALED 4.34 INCHES AT KEY WEST   
INTERNATIONAL AIRPORT. THIS BROKE THE PREVIOUS RECORD OF 2.89
INCHES...WHICH WAS SET IN 1872. IN FACT...THIS WILL ALSO GO DOWN AS
THE WETTEST FEBRUARY DAY IN HISTORY. THE PREVIOUS RECORD OF 4.04
INCHES WAS SET ON FEBRUARY 28TH...1954.

..24-HOUR RAINFALL TOTALS...IN INCHES...FOR AVAILABLE STATIONS

KEY WEST INT'L AIRPORT 4.34
KEY WEST WFO 3.79
KEY LARGO NORTH--HANDAR 2.74
BIG COPPITT KEY--COCORAHS 2.26
CUDJOE KEY--COCORAHS 1.68
CURRY HAMMOCK--COOP 1.50
BIG PINE KEY--HANDAR 1.26
CUDJOE KEY 1.08
MARATHON AIRPORT 1.03
Image (click to enlarge): Radar-estimated rainfall for the Key West, Florida region, February 5, 2012, from wunderground.com

Wednesday, January 25, 2012

Dallas Deluge Demolishes Daily Downpour Data;
New January Daily Rainfall Record, Second Wettest January

Following last year's exceptional drought, the climate pendulum has jumped to the opposite extreme, bringing record rainfall and floods to portions of north Texas. Although the National Weather Service reports that the heavy rain has ended, the 3.54" of rain so far today at Dallas is nearly 3 times the old record for the date of 1.28" in 1973. The daily total is also an all-time January daily record, exceeding the 3.15" on January 4, 1998, and it's the second-highest daily total for any winter day (December-February), behind the 4.22" on December 20, 1991.

The January 2012 monthly total to date of 6.04" is approaching 4 times the normal amount of 1.66". It also surpasses the 5.58" in January 2007 to become the second wettest January, behind 9.07" in 1932.

Note: Although the Dallas/Ft. Worth climate record is considered continuous back to 1898, data have been collected at several locations in the area:
  • 1898-1940: Downtown Fort Worth
  • 1940-1953: Fort Worth Meacham Field
  • 1953-1974: Greater Southwest International Airport
  • 1974-present: Dallas/Fort Worth International Airport
Image (click to enlarge): 24-hour rainfall totals ending 1 pm CST, January 25, 2012, in the Dallas region, from National Weather Service

Tuesday, December 27, 2011

Chicago Precipitation Update: 2011 Second Wettest Year

The 0.06" of rainfall through 4 pm today pushes the Chicago year-to-date rainfall to 49.41", exceeding the previous second highest annual total recorded in 1983.

Wednesday, December 14, 2011

Record Daily Rainfall Pushes Chicago Toward 2nd Wettest Year

December 15 Update: Yesterday's final rainfall total of 1.43" exceeded the old daily record at Chicago by over 40%. The monthly total to date, including an additional 0.02" today, brings the annual amount to 49.20", only 0.15" below the second highest on record.

Original post:
Today's heavy rainfall at Chicago set a daily record for December 14 and pushed the annual total closer to the second wettest year in 140 years of records. The 1.13" reported in the preliminary daily summary as of 4 pm CST exceeded the 0.99" first observed in 1907 and tied in 1975. The year to date total of 48.88" is 36% above the normal amount of 35.83". This is the third highest annual total, behind:
1) 2008   50.86"   
2) 1983 49.35"
The 1.35" at Peoria also exceeded the daily record of 1.14" in 1975. The year to date total there of 39.12", however, is behind the 41.29" last year.

The 0.5" of snow so far this month at Chicago is well below the average amount of 3.3". Last year at this time, the monthly total was 6.9". Temperatures so far in December have averaged 4.2° above normal.

Thursday, December 8, 2011

Precipitation Records Broken Tennessee to New England


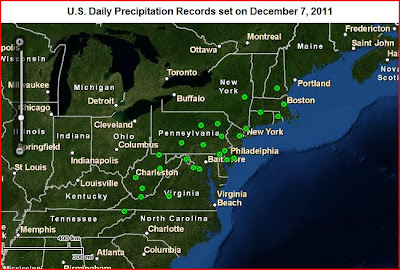
Images (click to enlarge): 24-hour precipitation ending 7 am EST, December 8, 2011, from National Weather Service; Locations of daily precipitation records, December 7, 2011, from National Climatic Data Center

In addition to the all-time cold-season (November-March) daily rainfall record set at Washington, DC, records were also broken at 25 other major reporting locations (ASOS stations) on December 7. According to preliminary data from the National Climatic Data Center, the following new daily rainfall records were set from Tennessee to New England (alphabetical by state, amounts in inches):
State Location                        New     Old     Date   Years of Record
CT HARTFORD (KBDL) 2.05 1.8 12/7/1976 69
DE WILMINGTON NEW CASTLE (KILG) 1.94 1.09 12/7/1976 69
MA BOSTON (KBOS) 1.6 1.15 12/7/1959 91
NH CONCORD ASOS (KCON) 1.52 1.2 12/7/1976 90
NJ MILLVILLE MUNI AP (KMIV) 2.46 1.94 12/7/1971 64
NJ NEWARK INTL AP (KEWR) 1.9 1.26 12/7/1996 76
NJ ATLANTIC CITY INTL AP (KACY) 1.55 1.46 12/7/1971 64
NY WESTCHESTER CO AP (KHPN) 1.55 1.45 12/7/1976 62
NY ALBANY INTL AP (KALB) 1.43 0.88 12/7/1976 73
PA PHILADELPHIA INTL AP (KPHL) 2.04 1.14 12/7/1996 70
PA ALLENTOWN AP (KABE) 1.72 1.54 12/7/1976 63
PA WILLIAMSPORT RGNL AP (KIPT) 1.55 1.37 12/7/1976 63
PA WILKES-BARRE INTL AP (KAVP) 1.32 1.04 12/7/1976 62
PA ALTOONA FAA AP (KAOO) 1.31 1.04 12/7/1976 62
PA MIDDLETOWN HARRISBG AP (KMDT) 1.25 0.95 12/7/1959 76
RI PROVIDENCE (KPVD) 1.55 1.43 12/7/1976 69
TN BRISTOL AP (KTRI) 1.46 1.25 12/7/1957 63
VA WASHINGTON REAGAN AP (KDCA) 3.1 1.34 12/7/1971 75
VA WASHGTN DULLES INTL AP (KIAD) 2.14 1.13 12/7/1976 49
VA LYNCHBURG INTL AP (KLYH) 1.8 1.13 12/7/1976 81
WV ELKINS RANDOLPH CY AP (KEKN) 1.8 1.35 12/7/1957 85
WV BLUEFIELD MERCER CO AP (KBLF) 1.71 0.72 12/7/1996 52
WV BECKLEY RALEIGH CY AP (KBKW) 1.66 0.85 12/7/1971 48
WV MARTINSBURG E WV RGNL AP (KMRB) 1.46 1.05 12/7/1976 85
WV CHARLESTON YEAGER AP (KCRW) 1.3 0.89 12/7/1950 63
WV MORGANTOWN HART FLD (KMGW) 1.11 0.95 12/7/1976 66
In addition to the Washington, DC record, the Bluefield report is also an all-time December daily record.

Wednesday, December 7, 2011

Rainfall Sets Mid-Atlantic Records;
Update: Wettest December Day in History

1 AM Update: The final record-breaking total daily rainfalls:
Washington National 3.10" (1.34", 1971)
Washington Dulles 2.14" (1.13", 1976)
Baltimore/BWI 2.38" (1.27", 1976)
The Washington National amount exceeded the normal monthly precipitation of 3.05" for December.

10 PM Update: With 0.14" more rain in the past hour, the daily total is unofficially over 3" for the first time in ANY MONTH from November through March! Here are the previous daily records for each month:
Nov 2.95" 1943
Dec 2.81" 1977
Jan 2.77" 1915
Feb 2.29" 1896
Mar 2.79" 1881
9 PM Update: Washington National has now had just under 1" of additional rainfall since 4 pm, bringing the total to 2.91". This is now unofficially the wettest December day since precipitation records began in 1871, exceeding the old record of 2.81" on December 18, 1977.

Original post:
Cold-season precipitation extremes tend to be lower than those in warmer seasons because cold air holds less moisture than warm air. With heavy rainfall still falling, however, daily precipitation records for December 7 have already been set as of 4 pm in the Mid Atlantic area. Current totals (old records in parentheses):
Washington National 1.93" (1.34", 1971)
Washington Dulles 1.33" (1.13", 1976)
Baltimore/BWI 1.18" (1.27", 1976)
Note: The Baltimore record was easily exceeded by the 0.54" which fell in the next 3 hours.

Friday, September 9, 2011

Lee's Leftovers Loosen Soggy Stranglehold on Mid Atlantic;
Record Rain Relinquishes Reign


Image (click to enlarge): Mid Atlantic precipitation for 7 days ending 8 am EDT, Sept. 9, 2011, from National Weather Service

After drenching the Mid Atlantic region for most of the week, the remnants of Tropical Storm Lee have finally let up their relentlessly rainy reign. Although some flash flood warnings and watches as well as river flood warnings remain in effect, the heaviest rainfall has ended, leaving behind some record-breaking accumulations. Double-digit storm totals have been recorded across at least 10 states from Louisiana to New York. The highest amount appears to be 20.96" at a cooperative station near Colonial Beach, VA, but a plume of very heavy rainfall extended northward through the Susquehanna River watershed of Pennsylvania and New York.

In the immediate Washington/Baltimore area, official storm total rainfall reports include:
Washington National  6.47 
Washington Dulles 6.44
Ft. Belvoir 13.48
Baltimore BWI 8.11
Baltimore Downtown 6.90
Andrews AFB 9.06
Patuxent River 2.13
Selected reports of 10" or more as of 2 pm today from the National Weather Service include:
...ALABAMA...
FYFFE 6.3 NNE 12.94
MOBILE 10.2 WSW 12.93
ALBERTVILLE 4.8 WNW 12.44
TILLMANS CORNER 4.3 WNW 11.74
GRAND BAY 0.6 NW 11.32
ORANGE BEACH 3.0 ENE 10.50
FOLEY 2.0 SSW 10.39

...FLORIDA...
MILTON 1.4 NNE 10.03

...GEORGIA...
LA FAYETTE 2.9 NE 11.01
RINGGOLD 5 W 10.21

...LOUISIANA...
HOLDEN 15.43
N.O. CAROLLTON 14.32
MAUREPAS 13.63
PONCHATOULA 4 SE 13.22
CONVENT 2 S 13.04
WESTWEGO 1.8 NE 13.03
RESERVE 0.5 SSE 12.89
GRAY 0.5 ENE 12.15
NEW ORLEANS/MOISANT 11.00

...MARYLAND...
WALDORF 3.6 SSE 13.63
CROFTON 1.5 NNE 11.85
ELLICOTT CITY 1.7 N 11.36
CLARKSBURG 10.60

...MISSISSIPPI...
WAVELAND 1.1 NW 14.11
FLORENCE 0.9 E 13.45
SAUCIER 6.4 ESE 11.75
GULFPORT 2.0 NE 11.71
LONG BEACH 0.7 S 11.59
PASS CHRISTIAN 5.0 N 11.31
RICHLAND 0.3 WSW 11.25
PHILADELPHIA 5.4 E 11.18
JACKSON WFO 11.15
GULFPORT-BILOXI 11.14
PASCAGOULA 10.96

...NEW YORK...
APALACHIN 3.0 SE 11.83
ENDICOTT 5.2 SSE 11.46
TIOGA TERRACE 10.64
BINGHAMTON/BROOME 10.09

...PENNSYLVANIA...
ELIZABETHTOWN 1.1 NNE 15.58
PINE GROVE 14.70
PAXTONIA 1.7 E 13.95
HARRISBURG AIRPORT 13.30
MUIR AAF/INDIANTOWN 12.58
WILLIAMSPORT 10.20

...TENNESSEE...
CLEVELAND 3 ESE 12.22
CHARLESTON 11.50
CHATTANOOGA-LOVELL FIELD (ASOS) 10.28

...VIRGINIA...
COLONIAL BEACH 1.2 SSE 20.96
WOODBRIDGE 0.5 SSW 16.20
LORTON 1.2 NE 15.09
FORT BELVOIR/DAVISON AFB 13.77
RESTON 2 N 11.45
CHANTILLY 2 ESE 10.18

Thursday, September 8, 2011

All-Time Daily Rainfall Record at Binghamton: Second in 2 Years


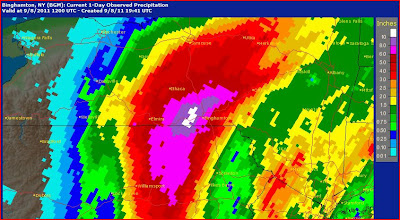
Image (click to enlarge): Binghamton region 24-hour precipitation ending 8 am EDT, Sept. 8, from National Weather Service

6 PM Update: As of 5 pm, an additional 1.41" of rain has fallen at Binghamton today, bringing the monthly total to 10.08" and the yearly total to 51.27". After slightly more than a week, this month's total is now the second highest all-time amount, behind the 11.45" in June 2006.

Original post:
After setting an all-time daily precipitation record just last September, Binghamton, New York has smashed that record by a wide margin with 7.49" yesterday (Sept. 7). Since the previous record was set in 2006, the 3 highest daily rainfall amounts at Binghamton have now occurred within the last 5 years. Climate records began in 1951 at the current airport location, but climate data in the city extend back to 1890. The record rainfall for any 24-hour period at the previous location was 4.55" in Sept. 1924.

The year-to-date total rainfall is also a new all-time annual record.

The National Weather Service report:
A RECORD RAINFALL OF 7.49 INCHES WAS SET AT THE BINGHAMTON REGIONAL
AIRPORT YESTERDAY. THIS BREAKS THE OLD RECORD FOR SEPTEMBER 7TH OF
0.80 INCHES SET IN 1996.

THIS CALENDAR DAY RAINFALL ALSO SHATTERS THE RECORD FOR ANY DAY.
THE OLD RECORD WAS 4.24 INCHES ON SEPTEMBER 30TH IN 2010.

PRECIPITATION FOR THE YEAR NOW TOTALS 49.86 INCHES AS OF MIDNIGHT.
THIS BREAKS THE OLD RECORD FOR ANY YEAR OF 49.78 INCHES SET IN 2006.
NORMAL PRECIPITATION FOR REST OF THE YEAR IS CLOSE TO 10 INCHES SO
THIS SHOULD BREAK THE RECORD BY MANY INCHES.

Wednesday, September 7, 2011

Record Daily Rainfall for September at Harrisburg

Sept. 8, 2 PM Update: The final Harrisburg daily rainfall total for Sept. 7 is 7.71". The 2-day total is 9.73". The storm total since Sunday evening is 13.30" as of 9 am today.

Sept. 8, 1 AM Update: Heavy rain has continued through midnight at Harrisburg, with 2.08" just in the hour ending at 1 am EDT (midnight standard time). That puts the daily total at the 2nd highest of all time.

Original post:
Downpours from the remnants of Tropical Storm Lee have been producing record rainfall amounts in the Mid Atlantic area. The National Weather Service reports that the 5.05" of precipitation as of 5 pm today at Harrisburg, Pennsylvania has already smashed the old daily record of 1.18" set in 1998. Unofficially, this is also an all-time daily record for September, beating the 4.59" on Sept. 26, 1975. The top two all-time daily rainfall records at Harrisburg were set on June 21 and 22, 1972 from the remnants of Hurricane Agnes. Today's amount is now the 3rd highest all-time amount.

The 2-day total on Sept. 25-26, 1975 was 8.87". Together with the 2.02" yesterday, the current 2-day total is 7.07". Climate records began at Harrisburg in 1888.

The previous top 10 daily rainfall amounts at Harrisburg:
22-Jun 1972 9.13
21-Jun 1972 5.81
31-May 1889 4.66
23-Aug 1933 4.66
26-Sep 1975 4.59
14-Sep 1973 4.34
21-Aug 1915 4.30
25-Sep 1975 4.28
10-Sep 1907 4.17
23-Jul 1969 4.00
Image (click to enlarge): Mid Atlantic radar image September 7, 2011, from Accuweather

Tuesday, September 6, 2011

Lee Rainfall Breaks Every All-Time Record from 24 Hours to a Week at Jackson MS


Image (click to enlarge): Storm total rainfall in the Jackson, Mississippi region ending 7 am CDT, Sept. 6, 2011, from National Weather Service

The torrential rains from Tropical Storm Lee have broken precipitation records for every interval from 24 hours to one week at Jackson, Mississippi. Jackson climate records date back to 1896. The National Weather Service reports:
THE FOLLOWING JACKSON PRECIPITATION RECORDS WERE BROKEN DURING THIS 
RAINFALL EVENT...

*ALL TIME 24 HOUR RAINFALL RECORD (10.68" FROM 9/4 9 AM - 9/5 9 AM)
PREVIOUS RECORD: 8.50" FROM 4/6/2003 11 AM - 4/7/2003 11 AM

*ALL TIME 2-DAY RAINFALL RECORD (10.82")
PREVIOUS RECORD: 8.54" ON APRIL 11-12 1979

*ALL TIME 3-DAY RAINFALL RECORD (11.15")
PREVIOUS RECORD: 9.81" ON APRIL 11-13 1980

*ALL TIME 4-DAY RAINFALL RECORD (11.15")
PREVIOUS RECORD: 9.82" ON APRIL 11-14 1980

*ALL TIME 5-DAY RAINFALL RECORD (11.15")
PREVIOUS RECORD: 9.82" ON APRIL 11-15 1980

*ALL TIME 6-DAY RAINFALL RECORD (11.15")
PREVIOUS RECORD: 10.45" ON APRIL 8-13 1980

*ALL TIME 7-DAY RAINFALL RECORD (11.15")
PREVIOUS RECORD: 10.55" ON APRIL 7-13 1980

*SEPTEMBER 4TH DAILY RAINFALL (5.12")
PREVIOUS RECORD: 2.37" IN 1949

*SEPTEMBER 5TH DAILY RAINFALL (5.70")
PREVIOUS RECORD: 1.48" IN 1906

Saturday, September 3, 2011

Record Rainfall From Lee Approaches Exceeds Double Digits on Gulf Coast


Image (click to enlarge): Tropical Storm Lee rainfall totals through 7 pm CDT, Sept. 3, from National Weather Service

Sept. 5, 11 pm Update: Updated storm totals of 10" or more reported by the Hydrometeorological Prediction Center:
SELECTED STORM TOTAL RAINFALL IN INCHES THROUGH 1 PM CDT 

...ALABAMA...
TILLMANS CORNER 4.3 WNW 11.74
MOBILE 10.2 WSW 11.62
GRAND BAY 0.6 NW 11.32
ORANGE BEACH 3.0 ENE 10.50
FOLEY 2.0 SSW 10.39
THEODORE 3.7 WNW 10.31

...FLORIDA...
MILTON 1.4 NNE 10.03

...LOUISIANA...
HOLDEN 15.43
N.O. CAROLLTON 14.32
MAUREPAS 13.63
PONCHATOULA 4 SE 13.22
CONVENT 2 S 13.04
RESERVE 0.5 SSE 12.43
GRAY 0.5 ENE 12.15
MARRERO 1.9 E 11.21
MONTICELLO 3.0 ENE 10.91
NEW ORLEANS/MOISANT 10.80
PONCHATOULA 11.8 E 10.59
MERAUX 0.8 WNW 10.10

...MISSISSIPPI...
FLORENCE 0.9 E 13.45
WAVELAND 1.1 NW 13.20
SAUCIER 6.4 ESE 11.75
GULFPORT 2.0 NE 11.71
LONG BEACH 0.7 S 11.59
PASS CHRISTIAN 5.0 N 11.31
RICHLAND 0.3 WSW 11.25
PHILADELPHIA 5.4 E 11.18
PEARL 3.4 ESE 11.14
JACKSON WFO 11.13
KILN 6.6 N 10.90
GULFPORT-BILOXI 10.78
Sept. 4, 11 pm Update: Updated official totals of 5" or more through 7 pm CDT:
HOLDEN              13.93   
N.O. CAROLLTON 12.97
MAUREPAS 11.97
CONVENT 2S 11.55
N.O. AUDUBON 11.42 THROUGH 7PM
GALLIANO 11.40
LIVINGSTON 11.24
N.O. ARMSTRONG 10.72 THROUGH 7PM
PASCAGOULA 10.70 THROUGH 7PM
SLIDELL CITY 10.62
COVINGTON 10.46
TERRYTOWN 3S 9.86
BILOXI 9.79 THROUGH 7PM
N.O. LAKEFRONT 9.48 THROUGH 7PM
PONCHATOULA 4SE 9.42
BAPTIST 9.31
GULFPORT AIRPORT 9.13 THROUGH 7PM
BOOTHVILLE 8.93 THROUGH 7PM
BAYOU MANCHAC PT 8.80 (I)
ROBERT 8.50
DENHAM SPRINGS 8.40
OCEAN SPRINGS 8.24
BATON ROUGE 8.17 THROUGH 7PM
ABITA RIVER 8.05
DONALDSONVILLE 4SW 7.82
B.R. SHERWOOD 7.79
MANDEVILLE 7.72
GONZALES 7.63
SLIDELL AIRPORT 7.52 THROUGH 7PM
BAYOU SORREL LOCK 7.26
BUSH 6.70
B.R. CONCORD 6.39
BOGALUSA 6.10
MCCOMB 5.87 THROUGH 7PM
KILLIAN 5.50 (I)
SUN 5.32
PLAQUEMINE 2N 5.03
Original post:
A report from the National Weather Service this evening shows rainfall amounts from Tropical Storm Lee approaching double digits along the Gulf Coast. Precipitation reports over 5" are shown below. The daily amounts of 4.95" through 5 pm today at New Orleans and 5.59" at Baton Rouge have already set new records for the date.
RAINFALL TOTALS ARE GIVEN IN INCHES. TOTALS BEGIN AT 7AM THURSDAY   
MORNING AND END AT 7AM THIS MORNING UNLESS OTHERWISE NOTED.
INCOMPLETE DATA IS NOTATED WITH AN (I) BEHIND THE OBSERVATION.

OFFICIAL NWS OBSERVATIONS
AUTOMATED OBSERVATIONS/CO-OP SITES

PASCAGOULA 9.59 THROUGH 7PM
N.O. AUDUBON 9.58 THROUGH 7PM
N.O. CAROLLTON 8.82
GALLIANO 8.80
N.O. LAKEFRONT 7.87 THROUGH 7PM
SLIDELL CITY 7.77
N.O. ARMSTRONG 7.63 THROUGH 7PM
BOOTHVILLE 7.19 THROUGH 7PM
GULFPORT 6.78 THROUGH 7PM
BILOXI 6.78 THROUGH 7PM
3S TERRYTOWN 6.74
4SW DONALDSONVILLE 6.13
BATON ROUGE 5.95 THROUGH 7PM
B.R. SHERWOOD 5.85
SLIDELL AIRPORT 5.62 THROUGH 7PM
KILLIAN 5.50
GONZALES 5.47
BAYOU MANCHAC 5.30 (I)

Tuesday, August 30, 2011

Irene Sets 25 All-Time Rainfall Records

Update: In addition to the 18 all-time records on August 28, there were 24 more which set new daily records for any date in August.

Original post:
Preliminary reports from the National Climatic Data Center (NCDC) indicate that rainfall from Hurricane Irene set 25 all-time daily rainfall records on August 27-29 from North Carolina to Maine. The map (click to enlarge) from NCDC shows the 18 locations which set records on August 28 alone. First Order National Weather Service stations include:
                 Amount    Previous Record

Danbury CT 5.35" 5.22" 2008-09-06
Teterboro NJ 5.41" 4.22" 2004-09-29
Glens Falls NY 3.67" 3.65" 1971-08-28
St. Johnsbury VT 4.83" 4.53" 1999-09-17
The St. Johnsbury climate record extends back 118 years.

Dr. Jeff Masters also reports that the 11.23" of rain at Mendo, Vermont "was the greatest single-day rainfall in Vermont's history, according to wunderground's weather historian Christopher C. Burt, beating the 9.92" that fell at Mt. Mansfield on 9/17/1999 during the passage of Tropical Storm Floyd. The 13.30" that fell on East Durham, NY during Irene was just shy of New York State's all-time 1-day rainfall record: 13.70" at Brewster on 9/16/1999, from Tropical Storm Floyd."

Saturday, August 27, 2011

Irene Sets Rainfall Records in North Carolina, Virginia, Maryland, Delaware, Pennsylvania, NJ, NY, CT, MA, NH, VT;
All-Time N Y City Record


Images (click to enlarge): Hurricane Irene radar image at 5:05 pm, August 27, from Intellicast; 24-hour precipitation ending 8 am, August 28, for New York, Philadelphia, Washington, and Richmond regions, from National Weather Service. [Update: Added 24-hour precipitation ending August 29 for Portland ME, Burlington VT, Albany NY, and Boston regions]

August 29, 3 PM Update: Updated daily rainfall records for August 28 (Sunday):
Caribou ME         1.52"  (0.98", 1967) 

Bangor ME 1.97" (1.71", 1973)
Concord NH 2.66" (1.99", 1911)
Burlington VT 3.38" (2.38", 1971)
St. Johnsbury VT 4.83" (1.97", 1971)
Massena NY 1.02" (0.80", 1971)
Albany NY 4.69" (3.50", 1971)
Heavy rain extended northward into Canada, where Sherbrooke, Quebec reported 107 mm, and Doaktown, New Brunswick had 89 mm. Montreal measured 56.4 mm, bringing the monthly total to 223.0 mm; normal for August is 92.7 mm.

August 28, 9 PM Update: Today's 3.99" of rain at Central Park, New York breaks the old record for the date of 1.80" set in 1971 and raises the new all-time monthly record to 18.95". That is 464% of the normal August amount to date. The Irene storm total is 6.71".

More new daily rainfall records from today (old record and year in parentheses):
Bangor ME          1.85"  (1.71", 1973)

Concord NH 2.54" (1.99", 1911)
Burlington VT 2.70" (2.38", 1971)
Worcester MA 3.80" (0.99", 1971)
Hartford CT 3.84" (1.35", 1971)
Albany NY 4.56" (3.50", 1971)
Binghamton NY 2.69" (1.66", 1990)
Islip NY 1.80" (0.72", 2006)
Newark NJ 5.22" (2.04", 1971)

August 28, 1:30 PM Update: The National Weather Service reports a near-record water level at the Battery in New York:
  AT 8:42 AM EDT THIS MORNING THE TIDE LEVEL AT THE BATTERY REACHED 

9.5 FEET MLLW. THIS IS THE SIXTH HIGHEST LEVEL EVER RECORDED AT THE
BATTERY. AT 9:06 AM A MAXIMUM SURGE OF 4.5 FEET OCCURRED WITH THIS
HIGH TIDE IN COMBINATION WITH THE ASTRONOMICAL TIDE.

OTHER NOTABLE LEVELS REACHED INCLUDE THE TOP TWO OF 11.2 FEET MLLW
AND 10.9 FEET MLLW WHICH OCCURRED DURING THE HURRICANE OF SEPTEMBER
1821 AND HURRICANE DONNA IN 1960 RESPECTIVELY...AND 9.6 FEET MLLW
DURING THE NOREASTER OF DECEMBER 1992.
August 28, 1 PM Update: Updated storm total rainfalls for Hurricane Irene, from National Weather Service:
Danbury CT         6.34"

Bridgeport CT 3.25"
Central Park NY 6.71"
White Plains NY 5.97"
Newark NJ 8.73"
Atlantic City NJ 4.56"
Philadelphia PA 4.84"
Dover DE 7.52"
Wilmington DE 5.77"
Georgetown DE 5.69"
Rehoboth Beach DE 4.88"
Salisbury MD 7.75"
Ocean City MD 12.09"
Baltimore MD 3.83"
Easton MD 11.34"
Washington DC 3.36"
Richmond VA 4.73"
Suffolk Airpt VA 11.04"
Elizabeth City NC 7.50"
August 28, Noon Update: The storm total rainfall of 6.71" at Central Park brings the monthly total to an unofficial 18.79", which is an all-time monthly record for New York City. The previous record was 16.85" in September, 1882.

Midnight Update: Philadelphia had 1.70" of rain in the 6 hours ending 8 pm and an additional 2.14" in the following 3 hours.

9 PM Update: Suffolk Airport in Virginia is reporting a storm total rainfall so far of 11.04". The Norfolk official total is incomplete, apparently because of a sensor failure of the automated station, but a co-operative observer reports 7.73".

7 PM Update: The National Hurricane Center reports:
RAINFALL AMOUNTS OF 10 TO 14 INCHES HAVE ALREADY OCCURRED OVER A

LARGE PORTION OF EASTERN NORTH CAROLINA...WITH THE HIGHEST AMOUNT
OF 14.00 INCHES REPORTED AT BUNYAN NORTH CAROLINA THUS FAR.
Original post:
Heavy rain is still falling from Hurricane Irene in North Carolina, Virginia, Maryland, and Delaware, but daily rainfall records have already been set as of 5 pm (old record in parentheses):
Richmond VA        3.42" (2.04", 1899)

Norfolk VA 4.47" (3.77", 1998)
Salisbury MD 3.05" (tie, 1922)
Georgetown DE 2.87" (1.14", 1964)
Elizabeth City NC 4.50" (4.33", 1971)
August 26:
New Bern NC 3.30" (2.45", 1999)
Cape Hatteras NC 3.67" (2.27", 1962)
Philadelphia has also added to its all-time record monthly rainfall with a total so far of 14.38". With 0.39" so far today, Central Park, New York has reached 12.47" for the month, which sets a new record for highest August rainfall.

Seasonal Outlook

Latest seasonal forecast: Click here.


Latest 3-month temperature outlook from Climate Prediction Center/NWS/NOAA.