Showing posts with label Flooding. Show all posts

Wednesday, June 20, 2012

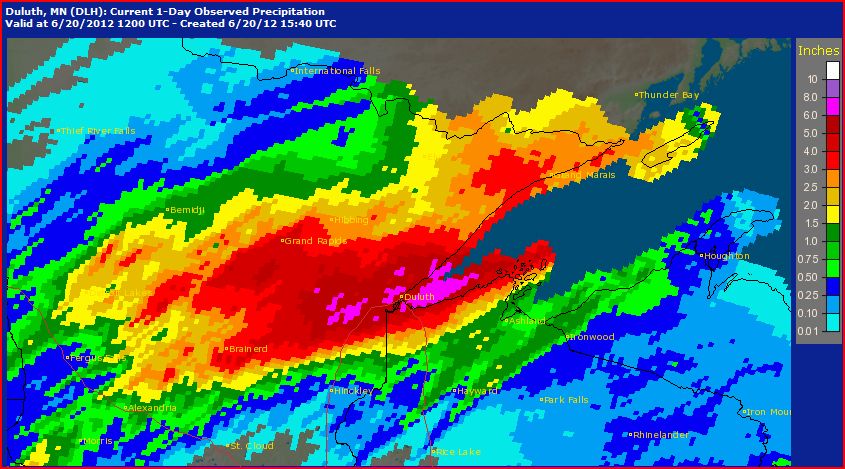
Deluge Drowns Duluth: Wettest June Day, Second Wettest All-Time in 142-Year Rainfall Record


Torrential rainfall up to 9" yesterday caused widespread flooding in the Duluth, Minnesota, area and closed roads, including I-35:
Major flooding in and around Duluth has isolated neighborhoods, drowned zoo animals and closed state parks, pushing the city's mayor to declare a state of emergency after more than 8 inches of rain had fallen across areas of northeastern Minnesota.

Steady, torrential rain closed Interstate 35 and downtown tunnels in Duluth. Police say sinkholes and washouts have made travel dangerous. Residents of the south Duluth neighborhood of Fond du Lac, near the rising St. Louis River, were being asked to leave their homes.
The National Weather Service simply noted drily that the daily rainfall record was smashed by a factor of over 2.5 to 1:
A RECORD RAINFALL OF 4.14 INCHES WAS SET AT DULUTH INTERNATIONAL
AIRPORT YESTERDAY. THIS BREAKS THE OLD RECORD OF 1.55 SET IN 1998.
A CapitalClimate analysis of National Climatic Data Center reports from downtown Duluth (1871 to 1941) and Duluth Airport (1941 to 2011) shows that this was also the all-time June record daily precipitation, exceeding the 4" on June 23, 1876. Furthermore, this was second only to the 5.2" on July 21, 1909 for the wettest day in the 142-year record.

Some other precipitation reports from the Duluth area:
INCHES  LOCATION                 ST  COUNTY           TIME
------ ----------------------- -- -------------- -------
9.00 4 SW DULUTH MN ST. LOUIS 0941 AM
DENFELD NEIGHBORHOOD OF WEST DULUTH
8.38 DULUTH MN ST. LOUIS 0800 AM
THIS MEASUREMENT WAS TAKEN IN THE MORLEY
HEIGHTS NEIGHBORHOOD.
8.34 ALBORN MN ST. LOUIS 1037 AM
7.72 ALBORN MN ST. LOUIS 0815 AM
7.41 4 E ISLAND LAKE MN ST. LOUIS 1130 AM
STORM TOTAL.
6.00 9 WSW PORT WING WI DOUGLAS 0830 AM
THIS ESTIMATE WAS TAKEN AT THE MOUTH OF THE
BRULE RIVER.
5.95 14 SSW BRIMSON MN ST. LOUIS 1200 PM
5.38 DULUTH MN ST. LOUIS 0700 AM
24 HOUR TOTAL
5.15 CASTLE DANGER MN LAKE 1200 PM
5.03 5 S PEQUOT LAKES MN CROW WING 0741 AM
4.36 DULUTH MN ST. LOUIS 0848 AM
4.09 SWAN RIVER MN ITASCA 0712 AM
3.44 12 N ISLE MN AITKIN 0800 AM
3.35 N BRAINERD MN CROW WING 0710 AM

Sunday, June 10, 2012

Over 1 Foot of Non-Tropical Rainfall Smashes 99-Year Pensacola Record by Nearly 7 X

Image (click to enlarge): 24-hour precipitation ending at 7 am CDT, June 10, 2012 in the Mobile-Pensacola region, from National Weather Service

5 PM CDT Update: Rainfall has gradually tapered off this afternoon at Pensacola, but the daily total is up to 1.92".

Original post:
Excessive rainfall from a nearly stationary non-tropical storm crushed the daily precipitation record at Pensacola, Florida on June 9 (Saturday). The 13.13" of rain drowned the old record of 1.95" set in 1913 by a factor of 6.7 to 1. It was also the second highest all-time daily rainfall amount, exceeded only by the 15.29" from a tropical storm on October 5, 1934. The previous all-time June daily record was 10.10" on the 29th in 1887.

Over 1" fell in each of 5 consecutive hours and in 7 out of 8 consecutive hours. The largest amount was 3.17" (over 1" more than the previous daily record) in the hour ending at noon. An additional 1.51" of rain had already been recorded by 1 pm CDT today. The record for June 10 is 2.81" in 1968. Pensacola climate records began in 1879.

The 5.79" at Mobile, Alabama also smashed the June 9 record, which was 1.39" in 1968.

This schematic map from the National Weather Service shows a slow-moving upper-level low pressure area and a stationary front along the Gulf Coast (click to enlarge):


Contrast the current situation with the track of the October 1-6, 1934 tropical storm, from NOAA (click to enlarge):

Thursday, September 8, 2011

Record River Flooding Forecast for Susquehanna Valley in PA, NY

Sept. 8, 4 PM Update: Added storm rainfall map.

Sept. 8, 2 PM Update: As of 2 pm, the river stage of 25.6 ft at Binghamton is above the old record. The current forecast crest is 26.2 ft.

Vestal is at 35.3 ft, which is over 1 foot above the old record, and the forecast crest is 36.9 ft.

The new forecast crest of 40.7 feet at Wilkes Barre is just 0.2 ft below the all-time record from storm Agnes in 1972.

Original post:
The record daily rainfall at Harrisburg on Wednesday was part of extremely heavy precipitation throughout the Susquehanna River watershed. As of midnight, the river depth of 16.4 ft. at Harrisburg was just below the flood stage of 17 feet. The crest of 26.2 feet predicted for Saturday would be the 4th highest on record at Harrisburg.

Upstream, the forecast 38.5 feet at Wilkes Barre would be the 2nd highest on record. At Vestal, New York, the current 30.5 feet is well above major flood stage, and the forecast of 34 feet would be an all-time record. The current 20.5 feet at Binghamton is also at major flood stage, and the forecast 26 feet early Thursday afternoon would beat the all time record of 25 feet on June 28, 2006.

Images (click to enlarge):
- Pennsylvania storm rainfall total, Sept. 4-8, 2011, from National Weather Service
- Observed and forecast river stages at Harrisburg, Wilkes Barre, Vestal, and Binghamton, from National Weather Service

Monday, July 25, 2011

All-Time Record Daily Rainfall Sends Chicago From 3rd Driest to 2nd Wettest July

July 28 Update: Chicago's Record Wettest July

Original post:
The National Weather Service (NWS) reports that the 6.86" of rainfall at Chicago on Saturday, July 23, broke the record for the date of 2.79" set just last year. It also set an all-time calendar day precipitation record, surpassing the 6.64" on September 13, 2008. The 8.20" of rainfall in a 24-hour period ending 7 am CDT Saturday was below the record set on August 13-14, 1987, however.

With one week remaining in the month, the July total of 9.04" is now slightly over half an inch below the July monthly record of 9.56" in July 1889. The 0.45" of rain which fell through the first 3 weeks of the month would have made this the 3rd driest July in 140 years of Chicago records dating back to 1871.

Image (click to enlarge): Chicago area 24-hour rainfall ending 7 am CDT, July 23, 2011, from NWS; Chicago rainfall rate and accumulation, July 23, 2011, from Iowa Environmental Mesonet via NWS

Tuesday, May 31, 2011

Hundred-Year Record Montana Rainfall Leads to Missouri River Flooding

Image (click to enlarge): Montana precipitation percentage of normal for 14 days ending 8 am EDT, May 31, from National Weather Service.

Record rainfall in Montana through the second half of May is threatening serious flooding on the Missouri River downstream into the Dakotas, Iowa, and Nebraska. Large portions of southeastern Montana have had rainfall as much as 600% of normal for the 14 days ending May 31.

From May 10 through the 25th, all-time May daily rainfall records were set at 10 locations in Montana. At Billings, where records extend back 76 years, the 3.12" on the 24th broke the previous May daily record of 2.83" set in 1952. Another 1952 record was broken at Livingston with 2.08" on the 24th. Two hundred-year records, originally set on May 26, 1911, were broken at Sidney with 2.42" and Ryegate with 2.21".

The 6.98" at Glasgow, Montana through this morning is a new monthly record for May, exceeding the 6.61" in 2007, and is 5.26" above the normal for the month. Glasgow climate records extend back to 1893.

Saturday, December 25, 2010

California Rainfall Smashes Records By Wide Margin

The torrential rainfall of the past week set numerous records in California and the southwestern U.S. For the 7 days ending December 23, the precipitation totals were off the chart---over 600% of normal for at least half of California and Nevada, nearly all of Utah, most of Arizona, and eastward into southern Wyoming and western Colorado.

The National Weather Service has reported that the monthly totals so far are now the wettest on record for December at the airports in Los Angeles, Long Beach, Camarillo, Santa Barbara, and Santa Maria. In some of the higher elevations of interior southern California, storm totals ranged as high as 28". The printed amounts on the map to the right are a little hard to read, but note that the yellow areas represent 24-28", and the orange pixels are over 28".

Several daily rainfall records were broken by spectacular margins. In the San Joaquin Valley, at Bakersfield, California, the 1.37" on the 18th was over 4.5 times the previous record, which dated back to 1921. The 1.53" on the next day was more than triple the old record and easily beat the all-time daily record for December of 1.02" on the 27th in 1936. Bakersfield climate records go back to 1889. The 24-hour total of 2.31" on the 18th-19th was double the old December record of 1.15" on December 3-4, 1914. It was also the 3rd highest all-time 24-hour amount at Bakersfield, just behind the 2.32" on January 24-25, 1999. The monthly total of 4.95" so far has exceeded by nearly 2" the old December record of 2.98" set in 1931. This is now within striking distance of the all-time wettest month for Bakersfield, 5.36" in February 1998.

At the higher elevations of central California, snowfall was measured not in feet, but in tens of feet. Here are some of the more amazing estimated amounts:
Location                County   Snowfall
PASCOES SNOTEL TULARE 204"
WEST WOODCHUCK MEADOW FRESNO 192"
CHAGOOPA PLATEAU SNOTEL TULARE 120"
WET MEADOWS SNOTEL TULARE 191"
BISHOP PASS SNOTEL FRESNO 195"
CRABTREE MEADOW SNOTEL TULARE 143"
KAISER POINT SNOTEL FRESNO 168"
Over 1900 daily rainfall records have been set through December 24 in the U.S., nearly 50% more than the total low temperature and high temperature records combined. Of these, 262 were set in California alone, with 58 on the 19th, 44 on the 20th, and 40 on the 22nd.

Meanwhile, despite the excess earlier in the month, daily low temperature records are less than 100 ahead of the daily high temperature records for December. The year-to-date ratio of heat records to cold records remains well in favor of the heat records at 2.4 to 1.

Images (click to enlarge): California, Nevada, Utah, and Arizona 7-day precipitation percentage of normal ending 7 am EDT, December 23 from National Weather Service (NWS); Storm total precipitation for southern California, December 17-23, from NWS; Monthly total of daily low temperature, high temperature, and precipitation records through December 24, CapitalClimate chart from National Climatic Data Center records

Thursday, September 30, 2010

East Coast Flooding From "Not-Nicole" Spreads Northward

As noted in the update to the previous post, the rain has finally ended in Wilmington NC, but the flooding from excessive rainfall fed in part by the moisture from what was formerly Tropical Storm Nicole is spreading northward. Here are some highlights from the Mid Atlantic and Northeast posted in The Weather Channel's twitch stream, arranged from south to north:
  • Reports of fire dept. rescues in New Bern, NC.
  • 32 streets reported flooded in the town of Ahoskie, NC.
  • Route 5 is now closed in Great Mills, MD. Numerous intersections remain closed in Fairfax County, VA.
  • Numerous Baltimore Co. closures due to flood including Route 40 in Catonsville Hts. More rain approaching.
  • Over 5" of rain triggered small-stream flood causing Millersville Univ. to close for the day. Downed trees also.
  • Widespread street flooding, with roads closed reported in Tremont, PA.
  • Already a top 10 wettest day on record in Allentown, PA (4.33").
  • NWS has adjusted downward the flood crest forecast for the Schuylkill @ Philadelphia to 14'. Would be highest since Floyd '99.
  • No travel advised due to numerous flooded roads in Cortland County, NY. Reports of evacuations in McGraw.
  • Flood becoming serious in central NY. Many roads covered by 6-12 inches of water in Rome, NY.
Image (click to enlarge): U.S. composite satellite image at 8 pm EDT, September 30, 2010 shows moisture streaming northward from the tropics over the Mid Atlantic coast and into the Northeast, from SSEC/University of Wisconsin.

Coastal North Carolina's Second 500-Year Rainfall in 11 Years

Oct. 5 Update: The flood waters have still not receded in many of the affected areas of North Carolina:
N.C. begins to survey damage from rain and floods

9 PM Update: The rain finally ended at Wilmington a little before 7 pm. The 6-hour total precipitation ending at 8 pm was 1.27".

6 PM Update: Wilmington has received 0.14" more in the last hour as the rainfall has diminished to moderate.

Elizabeth City's total so far today of 4.09" is still short of the record 4.52" for the date.

The 2.53" at Richmond VA is below the record of 2.85".

Today's 5.62" at Norfolk VA through 5 pm is a new record for the date. It's the third highest daily record for all of September. An additional 0.19" has fallen in the last hour.

5 PM Update: The 0.42" in the latest hour brings the 3-hour total to 1.11". As of 4 pm, today's total was 1.74" and September to date was 22.17".

Added Hurricane Floyd precipitation map (click to enlarge) from Climate Prediction Center/NOAA and links to Floyd reports.

4 PM Update: Heavy rain continues, 0.39" more in the last hour.

3 PM Update: An additional 0.30" has fallen in the last hour with visibility reduced to 1.5 miles in continuing heavy rain.

Original post:
Excessive rainfall in the Cape Fear region of North Carolina from a tropical conveyor belt including the remnants of Tropical Storm Nicole has broken the total rainfall record from Hurricane Floyd in 1999. The Floyd rainfall has been described by the National Weather Service as a once-in-500-year event.

The NWS reported this morning that the 19.66" at Wilmington in the 3 days ending yesterday is the highest 3-day total precipitation in records that began in 1871. The 10.33" on Monday is also the second highest all-time single day amount following Floyd's 13.38" on Sept. 15, 1999. The September total so far of 20.84" through this morning is the second highest for the month behind 1999. Heavy rain is continuing at Wilmington, and an additional 0.45" has fallen in the 6 hours ending at 2 pm EDT.

The map to the right (click to enlarge) from NWS shows North Carolina 7-day total precipitation ending at 8 am EDT this morning. The purple area extending from eastern South Carolina northward through the southeastern coast of North Carolina and to the Virginia border represents 10-15" of precipitation, with a smaller area near the coast of 15-20".

According to the NWS report, here is how the current event fits in with previous history:
OBSERVED TOTALS...  
SUNDAY SEP 26 0.59 INCHES
MONDAY SEP 27 10.33 INCHES
TUESDAY SEP 28 1.96 INCHES
WEDNESDAY SEP 29 7.37 INCHES
THURSDAY SEP 30 0.41 INCHES (1-3 INCHES MORE POSSIBLE)

1-DAY ALL-TIME RECORDS...
#1 13.38 INCHES 9/15/1999 (HURRICANE FLOYD)
#2 10.33 INCHES 9/27/2010 (MONDAY'S EVENT)
#3 9.56 INCHES 8/31/2006 (TROPICAL STORM ERNESTO)
#4 9.52 INCHES 9/29/1938
#5 8.04 INCHES 8/18/1879 ("GREAT BEAUFORT HURRICANE")

2-DAY ALL-TIME RECORDS...
#1 17.71 INCHES 9/15 & 9/16 1999 (HURRICANE FLOYD)
#2 14.73 INCHES 9/14 & 9/15 1999 (HURRICANE FLOYD)
#3 12.29 INCHES 9/27 & 9/28 2010 (MONDAY/TUESDAY'S EVENT)
#4 11.87 INCHES 10/7 & 10/8 2005 (TROPICAL STORM TAMMY)
#5 11.54 INCHES 7/7 & 7/8 1950

3-DAY ALL-TIME RECORDS...
#1 19.66 INCHES 9/27 - 9/29 2010
#2 19.06 INCHES 9/14 - 9/16 1999 (HURRICANE FLOYD)
#3 17.71 INCHES 9/15 - 9/17 1999 (HURRICANE FLOYD)
#4 14.73 INCHES 9/13 - 9/15 1999 (HURRICANE FLOYD)
#5 13.44 INCHES 9/11 - 9/13 1984 (HURRICANE DIANA)

4-DAY ALL-TIME RECORDS...
#1 20.25 INCHES 9/26 - 9/29 2010
#2 19.06 INCHES 9/14 - 9/17 1999 (HURRICANE FLOYD)
#2 19.06 INCHES 9/13 - 9/16 1999 (HURRICANE FLOYD)
#4 17.71 INCHES 9/15 - 9/18 1999 (HURRICANE FLOYD)
#5 14.73 INCHES 9/12 - 9/15 1999 (HURRICANE FLOYD)

5-DAY ALL-TIME RECORDS...
#1 20.66 INCHES 9/26 - 9/29 2010 (ONGOING EVENT THROUGH 720 AM...)
#2 19.06 INCHES 9/14 - 9/18 1999 (HURRICANE FLOYD)
#2 19.06 INCHES 9/13 - 9/17 1999 (HURRICANE FLOYD)
#2 19.06 INCHES 9/12 - 9/16 1999 (HURRICANE FLOYD)
#5 17.71 INCHES 9/15 - 9/19 1999 (HURRICANE FLOYD)

SEPTEMBER MONTHLY RAINFALL RECORDS...
#1 23.41 INCHES 1999 (HURRICANES DENNIS & FLOYD)
#2 20.84 INCHES 2010 (ONGOING EVENT THROUGH 720 AM...)
#3 20.10 INCHES 1877 ("HURRICANE FOUR")
#4 18.94 INCHES 1984 (HURRICANE DIANA)
#5 16.93 INCHES 1924 ("HURRICANE FIVE" AND "TROP STORM EIGHT")

Friday, July 23, 2010

Sinkhole Swallows SUV in Milwaukee Monsoon

Record-breaking rainfall caused widespread flooding across southern Wisconsin on Thursday. In Milwaukee, many roads and the city's airport were closed by high water. A sinkhole 40 feet wide and 20 feet deep swallowed a Cadillac SUV with the driver inside, along with a traffic light. The driver was rescued, although the fate of the vehicle was less certain.

The 5.79" of rain at Milwaukee was over 4 times the old record for the date, and it was the second highest daily precipitation of all time, second only to the 6.81" on August 6, 1986.

The 3.62" at Madison broke the old record for the date of 2.21" in 1885.

The National Weather Service reports:
A large area of moderate to heavy rain moved through southern Wisconsin Thursday morning, dumping 1.5 to 2 inches of rain across areas west of Madison, and .50 to 1.5 inches of rain east of Madison, including the Milwaukee metropolitan area. Milwaukee's Mitchell International Airport received 1.44 inches of rain during that morning round. Madison's Dane County Regional Airport received 1.47 inches. This helped set the stage for the major flooding that ensued later in the day.

During the afternoon, a persistent band of strong to severe thunderstorms developed and moved very slowly over south central and southeast Wisconsin through the evening hours. The individual storms were moving quite fast, about 40 to 50 mph, but the line containing these storms didn't, resulting in storms repeatedly training, or moving, over the same area. WIdespread 3 to 4 inch amounts were reported along and either side of the I-94 corridor, with locally higher amounts of 5 to 8 inches. Widespread reports of flooding and flash flooding associated with the heavy rain were received across southern Wisconsin, sending rivers and streams above flood level and water flowing over roads and stalling cars. Traffic was stopped on various stretches of the interstate system throughout downtown Milwaukee at the height of rush hour. Many motorists were stranded in their cars until the waters receded enough for traffic to move again.

Mitchell Field recorded 5.79 inches for the day...breaking a record for the date. The previous record was 1.26 set in 1948. This also is the second highest daily rainfall total on record for Milwaukee. The greatest one-day precipitation record was the 6.81 inches which fell on August 6, 1986.

Madison also set a record for precipitation for the date at 3.62 inches. This beat the previous mark of 2.21 inches set in 1885. The 3.62 inches ranks 13th for the most precipitation in one day. The record is the 4.96 inches which fell on August 8, 1906.
Green Bay, Wisconsin has already set a new July monthly rainfall record with 7.84". The normal rainfall amount through July 22 is 2.43".

Rainfall amounts of 3.5" to over 4" were reported in northern Illinois. Through 1 pm today, Rockford Illinois received 4.27", smashing the 1973 record of 1.73", and additional rainfall is possible through the rest of the day.

Flooding also occurred across Iowa, where the 2.24" broke the old daily record of 1.55" set in 1924 at Waterloo.

Images (click to enlarge): Southern Wisconsin precipitation for the 2 days ending July 23, 2010 from National Weather Service; Milwaukee sinkhole from Christian Science Monitor

Tuesday, June 22, 2010

Dozens Dead, Hundreds Missing in Brazil Floods

June 22 Update: The New Zealand Met Service blog reports phenomenal rains in the early part of June (tip of the wind vane to Hot Topic).

Original post:
The Northern Hemisphere is not unique in experiencing recent heavy flooding. Dozens are known dead, hundreds are missing, and perhaps as many as 100,000 are homeless following several days of torrential rainfall, as much as 14", in northeastern Brazil. Flooding is reported to have destroyed entire villages in the states of Alagoas and Pernambuco.
Video from Associated Press:

Monday, June 14, 2010

Oklahoma City Paralyzed By Flash Floods
All-Time Daily Rainfall Record Broken

See here for other heavy rainfall posts.

June 15 AM Update: The final daily rainfall for Oklahoma City is 7.62". This breaks the all-time daily rainfall record for any day in any month. The old record was 7.53" on Sept. 22, 1970.

Midnight Update: Another 0.05" fell in the remainder of the 11:00 hour, plus 0.11" ending at midnight. The estimated total is now 7.35" with one more hour remaining (daily records are kept on standard time).

Late PM Update: Another round of heavy thunderstorms this evening has added to the total: 0.12" through 7 pm CDT, then 0.89" more by 10:25, with a moderate thunderstorm continuing. This brings the unofficial (and incomplete) daily total to 7.19", easily breaking the all-time June daily record by close to half an inch (see below).

1 PM CDT Update: An additional 0.19" fell in the hour ending at 1:00, bringing the 6-hour total to 3.94" and the daily total to 6.18". Highest daily totals in the area are now over 10".

More thunderstorms are moving into central Oklahoma with heavy rain likely between 3 and 4 pm.

Original post:
The Oklahoma City metro area this morning joined the list of major cities smashing rainfall records in the last several years. As of 11 am CDT, the 5.88" so far today has blown past the previous June 14 record of 3.95" in 1930. Rain continues to fall, although at a lower rate; 0.17" fell in the hour ending at noon CDT.

The all-time June daily record is 6.75" on June 3, 1932. Weather records in Oklahoma City extend back to 1890. Rainfall amounts in the region range as high as nearly 9".

Local TV station KOCO is reporting portions of several interstate highways have been flooded.

Images (click to enlarge): Oklahoma City area rainfall from National Weather Service

Friday, March 27, 2009

Red River Rapidly Rising
Fargo Fights Flooding


11 pm Update: The latest observed value at 9:15 pm CDT is 40.79 ft.

Original post:
The latest observed stage of 40.69 ft. at 2:15 pm CDT on the Red River at Fargo, ND exceeds the record stage by over half a foot. Levels are forecast to crest at 42 to possibly 43 ft. and remain above the previous record through next week.

CapitalClimate comments at Climate Progress on the subject of Red River flooding.

Friday, June 23, 2006

Drought Busters

Tonight and Tomorrow


Forecast Confidence: Medium-HighThere is a Flash Flood Watch in effect for the entire DC region which has now been extended from 8pm tonight through Sunday morning. Conditions will be mostly cloudy and humid with an 80% chance of showers or thunderstorms tonight (mostly after 7pm) through tomorrow. Lows overnight will be in the low 70s, and tomorrow's highs will be in the low 80s.

For the outlook through Sunday, including weekend event forecasts, see Camden's post below.


Last night's late thunderstorms put on a spectacular light show in much of the Washington DC area, but heavy rain was again, like Monday, mainly limited to southern portions of the region. National picked up 0.71" of rain, and Dulles had 1.51", most of which fell in one hour. This was more than enough to set a new record for June 23 at Dulles. Most of the Maryland suburbs north of the Beltway, however, had very light amounts.

This afternoon's activity has been concentrated around the lower Potomac, Northern Neck of Virginia, and the Eastern Shore. Salisbury MD has had over 2.6" of rain, and Wallops Island VA was walloped with just under 3" in one hour. The heaviest storms are now slowly working their way into the Virginia Tidewater area.

As a cold front approaches and stalls out over the Mid Atlantic region, showers and thunderstorms are likely through tomorrow. As noted above, there is a Flash Flood Watch in effect for the entire area through Sunday morning. Rainfall amounts are expected to average 2 to 4 inches, with locally higher amounts. For an example of what 5"+ of rain can do in the wrong place, check out the photo of the parking deck at the Crabtree Valley Mall in Raleigh during a recent flash flood. Note the 7-foot clearance barrier.

CapitalWeather.com photo by Sarah Scolnik

Climate Corner


The National Center for Atmospheric Research (NCAR) yesterday announced the results of a study by NCAR scientists Kevin Trenberth and Dennis Shea on trends in Atlantic sea surface temperatures (SSTs), which have been associated with increased tropical storm activity. The researchers found that global warming explained 0.8° of the rise in tropical Atlantic SSTs, but the so-called Atlantic multidecadal oscillation (AMO) accounted for only 0.2°. This raises serious doubts about theories proposed by Colorado State's William Gray, among others, that the recent increase in hurricane activity is due strictly to the AMO.

The NCAR results are consistent with an article, "Atlantic Hurricane Trends Linked to Climate Change", (subscription required) in the June 13 issue of the American Geophysical Union publication EOS. The article, by Michael Mann of Penn State and Kerry Emanuel of MIT, describes a statistical (regression) analysis of tropical Atlantic SSTs. The authors conclude:
In short, there is no evidence that a natural climate oscillation such as the AMO contributes to long-term tropical North Atlantic SST variations.
In fact, they find that the apparent effect of the AMO may actually be the result of a partial masking of the global warming trend by aerosol cooling effects ("solar dimming").

Seasonal Outlook

Latest seasonal forecast: Click here.


Latest 3-month temperature outlook from Climate Prediction Center/NWS/NOAA.