Thursday, July 12, 2012

U.S. Drought Coverage Expands to Decade-Plus High of 80%

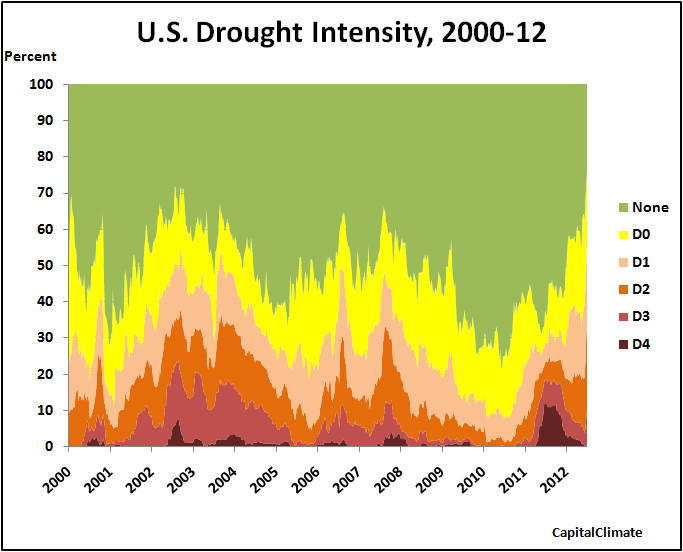
Despite increased rainfall, the latest U.S. Drought Monitor report, released this morning, shows that the area covered by some level of drought increased to 80% in the week ending July 10. This is up from 76% last week and is the highest dryness at least since Drought Monitor statistics began in 2000. Although D4 (Exceptional) coverage is still well below the extremes reached last summer, drought area increased for all levels except the lowest, D0 (Abnormally Dry).

CapitalClimate analysis of National Weather Service data from 215 major reporting locations across the 48 contiguous states shows that total precipitation for the week ending July 7 was just 51.5% of normal. Weekly precipitation was less than 0.25" at 125 stations, or 58% of the total locations.

The Drought Monitor national summary:
Rainfall was more abundant than last week. A broken pattern of moderate to locally heavy rains (isolated totals up to 5 inches) covered the central and southern Plains, the northernmost Plains and Great Lakes region, the immediate Ohio Valley, and a good chunk of the Southeast and interior mid-Atlantic. However, the heavier amounts were fairly isolated, and with the hot weather that covered much of the central and eastern United States, only a few scattered areas of dryness and drought experienced significant improvement. In addition, the areas with the greatest temperature anomalies (average daily maxima 10 to 13 degrees above normal) generally coincided with an area of scant rainfall across the Midwest, northwestern Ohio Valley, and southern Great Plains, resulting in another week of widespread deterioration and expansion of dryness and drought in these regions.
Images (click to enlarge): U.S. percentage area of drought, weekly from January 4, 2011 through July 10, 2012, CapitalClimate chart from U.S. Drought Monitor data; U.S. Drought Monitor map for July 10, 2012

Wednesday, July 11, 2012

Man Bites Dog: Extreme Weather and Climate Change Lead National Newscast

The lead story of last night's PBS NewsHour covered recent extreme weather events in the context of global climate change. The 8-minute segment included an extensive interview with Thomas Karl, Director of the National Climatic Data Center. In a stunning reversal of recent churnalistic practices, the message was not diluted by representation of phony skepticism (except in the spittle-flecked comments online). The real question, of course, is what happens to coverage of the issue when records are not being broken so spectacularly.

The intro:
JUDY WOODRUFF: The past 12 months are the warmest ever recorded in the United States since record-keeping began in 1895. That word comes as a new report from the National Oceanic and Atmospheric Administration says climate change, including human factors, has increased the odds of extreme weather. . .

Watch Extreme Weather Records 'Like a Baseball Player on Steroids' on PBS. See more from PBS NewsHour.

Tuesday, July 10, 2012

Michael Mann Interview on NewsChannel 8

Dr. Michael Mann was interviewed on Washington's NewsChannel 8 this morning regarding his book, The Hockey Stick and the Climate Wars. The climate scientist received top billing over the tax cut food fight.

Sunday, July 8, 2012

Weekly Weather Wee View: 30th Consecutive Warm Week, 90% of US Above Average


Preliminary data from 215 National Weather Service stations indicate that the 48-state contiguous U.S. average temperature was above normal for the 30th consecutive week in the 7 days ending yesterday (July 7). The Pacific coast was the only region with significantly cool temperatures while the heat intensified from the Midwest through the Mid Atlantic and Northeast.

The weekly unadjusted average was 6.1°F above the 1981-2010 climatology, up from 3.9°F the previous week. Over 90% of locations were warmer than average.

The warmest locations were Chicago and Rockford, Illinois; Grand Rapids, Michigan; and Madison, Wisconsin, each at +15°F and the coolest was San Diego, California at -5°F. No other location was more than 2°F cooler than average.

Images (click to enlarge):
- Weekly average U.S. temperature departures from normal, weeks ending June 4, 2011 (20110604) through July 7, 2012 (20120707); CapitalClimate chart from NOAA/NCDC data
- Weekly average NWS station temperature departures from normal, week ending July 7, 2012; stations listed alphabetically by state and 3-character station identifier; CapitalClimate chart from NWS data
- Average U.S. temperature departure from normal for week ending July 7, 2012 from High Plains Regional Climate Center

Preliminary July Heat Records Crushing Cold Records Nearly Over 40 to 1


9 PM Update: Later reports for July 7 have raised the July to date ratio of heat records vs. cold records to almost 41 to 1 (chart updated).

Original Post:
Based on preliminary National Climatic Data Center reports through mid morning, new daily record high temperatures for the first week of July have outnumbered low records by an incredible ratio of 38.7 to 1. However, yesterday's (July 7) reports are still incomplete. The chart will be updated when more data are available.

Saturday, July 7, 2012

Washington's Triple Triple Locks In Hottest First Week of July;
Earliest 105° on Record

5 PM Update: The Washington temperature has hit at least 105°F (40.6°C) as of 5 pm, within 1°F of the all-time high temperature record. This is also the earliest 105°F; the previous record was July 10, 1936.

Original Post:
The record high temperature of 104° so far today breaks the record of 102° set just 2 years ago and marks the third consecutive day with 100°+ temperatures in Washington. Along with the morning low of 82°, this virtually guarantees that the current week will close out as the hottest July 1-7 in Washington weather records. Since data collection began at or near the current National Airport location in 1929, the previous hottest first week of July was in 1999, when the average was 86.1°. Assuming no further change in today's readings, the 7-day average will be 88.9°. This is 7° above the pace of last year's all-time hottest month. In order to avoid breaking the weekly record, today's low would have to drop to at least 46°.

Friday, July 6, 2012

U.S. Drought Reaches Maximum Extent In At Least a Decade:
"Areas with record and near-record dryness too numerous to mention"


The latest U.S. Drought Monitor report, issued yesterday for data through July 3, shows that the total area of the 48 contiguous states in some level of drought (over 76%) is the largest since at least 2000. While Tropical Storm Debby virtually wiped out drought in Florida, much of the Southeast remains in drought, with over one-third of Georgia in Extreme or Exceptional drought (D3-D4). Other than Florida, the least droughty areas are generally in the corners: the Pacific Northwest, northern Great Lakes, and Northeast from Pennsylvania through New England.

From the Drought Monitor report:
Overall, this week featured the expansion and intensification of dryness in large sections of the country, with only southern Texas reporting some improvement. Light precipitation (0.5 inch or less) fell on most areas of dryness and drought, with only scattered areas reporting more than an inch, primarily in the northern Plains, lower Mississippi Valley, southernmost Great Lakes region, Appalachians, mid-Atlantic region, and southern Texas. This despite a couple of thunderstorm complexes that pushed rapidly from northern Illinois east-southeastward through the mid-Atlantic, including one on June 29 that caused significant damage, knocked out power for millions of customers, and took 2 dozen lives. Unfortunately, where rain did fall (outside southern Texas), it was not enough to make up for blistering heat that covered the Nation’s midsection, reaching the central and southern Atlantic Coast by the end of the workweek. Both the number of record highs in the past week, and the areas with record and near-record dryness over the last 1 to 3 months, are too numerous to mention. Daily high temperatures averaged above 100 degrees in the central and upper southern Plains, extending eastward into parts of Missouri and Arkansas, and average temperatures for the week were 8 to locally 15 degrees above normal from the Ohio Valley and upper Southeast westward through most of the High Plains. The dryness is beginning to take a significant toll on some of the Nation’s crops, pastures, and rangelands. In the primary growing states for corn and soybeans (18 each), 22 percent of the crop is in poor or very poor condition, as are 43 percent of the Nation’s pastures and rangelands and 24 percent of the sorghum crop. In addition, the area scorched by wildfires expanded significantly. Over 1.9 million acres have been engulfed since the start of the year, and increase of 38 percent in just the past week.
Images (click to enlarge): U.S. percentage area of drought, weekly from January 4, 2000 through July 3, 2012 (top) and January 4, 2011 through July 3, 2012 (middle), CapitalClimate charts from U.S. Drought Monitor data; U.S. Drought Monitor map for July 3, 2012

Seasonal Outlook

Latest seasonal forecast: Click here.


Latest 3-month temperature outlook from Climate Prediction Center/NWS/NOAA.