Friday, October 8, 2010

WaPo, WaPo, Wherefore Art Thou?
Press Sleeps While Climate Report Fraud Festers

4 PM Update: The WaPo has finally reacted to the story online in a post at 3:32 PM ET:
GMU investigating climate change skeptic cited by Cuccinelli
They still seem to think it's only a local story.

Original post:
Apparently the motto at the new, fashionably slim WaPo is, "Pulitzers, Pulitzers, we don't need no mo' stinkin' Pulitzers." Here's a little exercise in Googleology: Search "wegman washington post" and you get "Eighty-pound parmigiana cheese wheels from Italy . . . and 500 varieties of produce". Replace WaPo with "USA Today" and you get "University investigating prominent climate science critic".

Yes, Virginia, while your 17th-century AG was hunting witches in the UVa email archives from 2003, his alma mater George Mason University was sitting on a case of plagiarism and academic misconduct involving the author of the so-called "Wegman Report", upon which much of his witch hunt was based. From the USA Today online posting:
GMU spokesman Daniel Walsch confirms that the university, located in Fairfax, Va., is now investigating allegations that the Wegman report was partly plagiarized and contains fabrications. Last month, a 250-page report on the Deep Climate website written by computer scientist John Mashey of Portola Valley, Calif., raised some of these concerns. Mashey says his analysis shows that 35 of the 91 pages in the 2006 Wegman report are plagiarized (with some of the text taken from a book, Paleoclimatology: Reconstructing Climates of the Quaternary, by Raymond Bradley of the University of Massachusetts) and contain erroneous citations of data, as well.
According to a letter to Prof. Raymond Bradley of the University of Massachusetts dated July 28, the GMU committee to investigate the charges was evidently formed in April, and the work was expected to be completed by the end of last month.

Where is the fraud investigation, Mr. Cuccinelli, and where is the WaPo in reporting this?

Get the Politics Out of Science

5 PM Update: The Chronicle of Higher Education has an editorial also:
Ken Cuccinelli, Enemy of Freedom

Original post:
Climate scientist Michael E. Mann has an op-ed piece in Friday's WaPo:
Get the anti-science bent out of politics
Challenges to policy proposals for how to deal with this problem should be welcome -- indeed, a good-faith debate is essential for wise public policymaking.

But the attacks against the science must stop. They are not good-faith questioning of scientific research. They are anti-science.
(Tip of the rabbit ears to the Herr Hare.)

Thursday, October 7, 2010

NCDC/NOAA Confirms September Heat

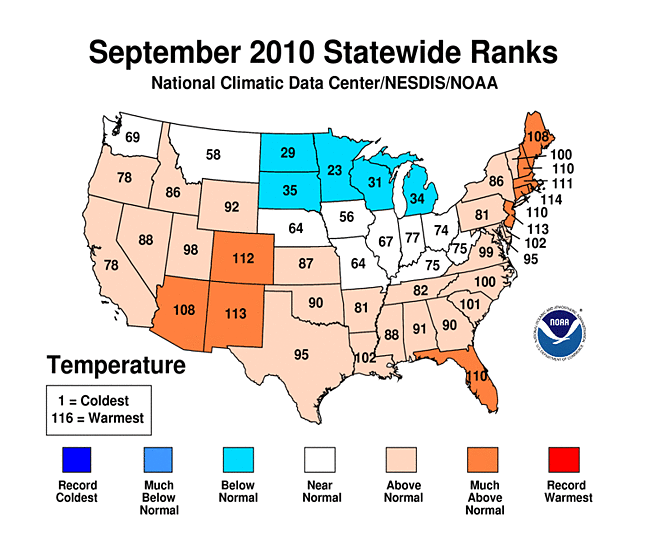
As indicated by the large number of daily record high temperatures in September, the month averaged above normal for the U.S. overall. According to the preliminary monthly analysis posted by NOAA's National Climatic Data Center within the last hour, the September monthly average was 1.7°F above the climatological mean. This was the 14th warmest September in 116 years of records and the 4th consecutive month with temperatures warmer than average.

Only 5 states (North and South Dakota, Minnesota, Michigan, and Wisconsin) averaged below normal, and no state was in the top 10 coolest Septembers. On the other hand, all New England states, except Vermont, had top-10 warmest Septembers. In addition, New Jersey, Florida, Colorado, New Mexico, and Arizona ranked in the top 10 of their respective temperature histories.

For the first 3 quarters of 2010 (January-September), the national average temperature was 1.0°F above the climatological mean. The Northeast region (Maryland northward through New England) had its warmest year-to-date on record at 3.3°F above average. On a statewide basis, all 6 of the New England states plus New Jersey had a record warm January-September. In addition, every other state from Virginia northeastward had a top-10 year-to-date. This included Maryland, Delaware, Pennsylvania, and New York. Despite the cool September, Michigan and Wisconsin also had top-10 warmest temperatures for the period. Texas (38th coolest) and Florida (22nd coolest) were the only 2 states to average below the long-term mean.

Images (click to enlarge): U.S. statewide average temperatures for September and 2010 year-to-date from National Climatic Data Center

Wednesday, October 6, 2010

Virginia's Climate Follies 2.0: Cooch's Climate Crusade

The WaPo, which has been subjected to well-earned criticism for its coverage of climate science and policy, demonstrates in an editorial today that it does have at least some clue regarding the witch hunt currently being perpetrated by the Virginia Attorney General. Under the headline, "Ken Cuccinelli seems determined to embarrass Virginia", the editorial points out:
The attorney general's logic is so tenuous as to leave only one plausible explanation: that he is on a fishing expedition designed to intimidate and suppress honest research and the free exchange of ideas upon which science and academia both depend -- all because he does not like what science says about climate change.
This sums up the situation quite well as far as it goes, but the WaPo crew are missing a golden opportunity to expose the real fraud behind this abortion of a legal case. (BTW, isn't the Cooch vehemently opposed to abortion?) Leaving aside the issue of whether the "real journalists" should have done the heavy lifting, a meticulous dossier has already been assembled in the blogosphere regarding the fraudulent underpinnings of the Cooch's crusade. In a guest post at the Deep Climate blog, John Mashey summarizes his exhaustive 200+ page analysis of the questionable scholarship, including multiple instances of apparent outright plagiarism, behind the GMU-based Wegman Report, upon which much of the Virginia AG's case is based:
The report itself contains numerous cases of obvious bias, as do process, testimony and follow-on actions. Of 91 pages, 35 are mostly plagiarized text, but often injected with errors, bias and changes of meaning. Its Bibliography is mostly padding, 50% of the references uncited in the text. Many references are irrelevant or dubious. The team relied heavily on a long-obsolete sketch and very likely on various uncredited sources.
In addition to evidence of the apparent fraud being perpetrated on the campus of George Mason, it might also be useful to investigate the finances of a "non-profit" organization evidently operating out of an apartment at:

1600 South Eads Street, Suite #712-S
Arlington, VA 22202-2907
Tel/Fax 703-920-2744

Image (click to enlarge): Tom Toles cartoon, Oct. 6, 2010, from Washington Post

Monday, October 4, 2010

Endless Summer XII: September's Sweltering Summary

For related record temperature posts, see:
The recent all-time record high temperature at Los Angeles got all the press attention, but that event was just one of literally thousands of daily high temperature records set in the U.S. during September. This continues a trend of heat records which has prevailed for nearly all of 2010 so far.

Following the blistering first 3 weeks of August, in which heat records outpaced cold records by a 7:1 ratio nationwide, a cooler surge in the final week brought the final ratio to 3.5:1. This was still much above the 2:1 average of the previous decade.

In September, daily high temperature records numbered nearly 2400, roughly 1/3 above the previous monthly high for the year, which was slightly less than 1800 in April. With only 459 daily low temperature records, the ratio of heat records to cold records was 5.2:1, the highest for any month since April's 6.1:1 dominated the spring statistics. The year-to-date ratio has now risen to 2.6:1. Every month this year from March onward has had at least twice as many heat records as cold records, except for May, when the ratio was 1.4:1.

September also had a large number of record high minimum temperatures (1,286) vs. low maximums (557), a ratio of 2.3:1.

The analysis from NOAA's Earth System Research Laboratory shows that average temperatures in September were warmer than the 1968-1996 base period over nearly all of the U.S. (Green/yellow/orange areas are warmer than average, and blue/purple areas are cooler on the map.) The notable exception was over the extreme northern Plains and the immediate Pacific Coast. This was consistent with the pattern prevailing for the entire June-September period.

Images (click to enlarge):
- Total number of daily high and low temperature records set in the U.S. for spring 2010 (March-April-May) and monthly from June through September 2010, data from NOAA National Climatic Data Center, background image © Kevin Ambrose. Includes historical daily observations archived in NCDC's Cooperative Summary of the Day data set and preliminary reports from Cooperative Observers and First Order National Weather Service stations. All stations have a Period of Record of at least 30 years.
- U.S. surface temperature departure from average (°C) for Sept. 2010 and June-Sept. 2010 from Earth System Research Laboratory/NOAA

Friday, October 1, 2010

Daily Rainfall Records Drowned from Mid Atlantic to Northeast

Oct. 6 Update: The Northeast Regional Climate Center reports that an additional record was set on Sept. 30 at Elkins WV: 1.86" (old record 1.03" in 1976).

Original post:
In addition to the records set earlier in North Carolina, the torrential rainfall from a weather system fed in part by the moisture from the remnants of Tropical Storm Nicole smashed rainfall records yesterday and today from the Mid Atlantic area through the Northeast. In the Washington DC region, records were set at all 3 major reporting locations.

At Washington National, the 4.66" exceeded by nearly 2" the old record for the date of 2.76" set in 1924. This was also the third highest September daily amount for the 140 years of records, behind 4.76" on the 16th in 1976 and 5.16" on the 2nd in 1922. Washington DC records began in 1871.

At Washington Dulles, the 4.74" destroyed by a factor of 5 the old record for Sept. 30 of 0.86" set in 1976. It was also the third highest amount for any day in September, exceeded only by 5.11" on the 6th in 2008 and 5.52" on the 14th in 1966. This means that 2 out of the 3 highest daily totals for September at Dulles have now been set in the last 3 years. Records began at Dulles in 1963.

At Baltimore-Washington International, the 6.02" was almost four times the previous Baltimore record of 1.60" in 1920. It was the highest amount for any day in September since records began in 1870. The old record was 5.97" on the 24th in 1912. It was also the second highest rainfall for any day in any month at Baltimore, behind the 7.62" on Aug. 23, 1933.

The combined total of 15.42" at the 3 locations is the second highest for any day since records began at Dulles. The highest was the 18.97" from Tropical Storm Agnes on June 21, 1972. The other dates with totals over 10" were:
6/25/2006 13.88"
9/14/1966 13.41"
9/5/1979 11.85"
10/8/2005 10.83"
9/16/1999 10.74"
9/6/2008 10.25"
Rainfall amounts were even higher along the western shore of the Chesapeake Bay, ranging up to 13" in southern St. Mary's County MD.

Other daily rainfall records set on Sept. 30 and Oct. 1 (old record in parentheses):
Sept. 30:
Elizabeth City NC 5.86" (4.52", 1971)
Richmond VA 3.69" (2.85", 1924)
Norfolk VA 7.85" (3.88", 1943)
Wilmington DE 4.32" (3.56", 1924)
Allentown PA 5.73" (3.72", 1934)
Philadelphia PA 2.41" (2.38", 1900)
Reading PA 5.15" (2.48", 1924)
Mt. Pocono PA 5.74" (3.00", 1920)
Harrisburg PA 3.22" (2.00", 1920)
Williamsport PA 3.91" (3.90", 1924)
Avoca PA 3.69" (3.33", 1924)
Binghamton NY 4.24" (0.90", 1999)
Syracuse NY 2.66" (1.53", 1924)
Albany NY 2.68" (2.51", 1920)
Massena NY 3.41" (1.22", 1986)
Newark NJ 1.21" (1.15", 1983)
Bridgeport CT 0.73" (0.65", 1983)
Montpelier VT 1.91" (0.91", 1959)
Oct. 1:
Wilmington DE 3.23" (2.50", 1902)
LaGuardia NY 2.24" (1.12", 1979)
Kennedy Airpt NY 2.02" (1.37", 1966)
Albany NY 3.04" (1.02", 2006)
Newark NJ 2.36" (1.50", 1936)
Burlington VT 1.49" (1.25", 1977)
Hartford CT 2.15" (1.57", 2006)
Worcester MA 2.19" (1.53", 1966)
Concord NH 1.33" (1.30", 1979)
The Norfolk rainfall was the second highest for any day in September, behind only the 8.93" on the 1st in 2006. Seven of the 30 daily records for September at Norfolk have now been set in the last 9 years. Norfolk precipitation records began in 1871.

The Binghamton amount was a new all-time daily record, beating the old record of 4.05" on June 27, 2006. The old September daily record was 3.50" on the 27th in 1985. The top two all-time daily precipitation amounts at Binghamton have now occurred in the last 5 years. Binghamton records began in 1951.

The Albany total was the second highest for any day in October, slightly under the 3.09" on the 9th in 1903. Albany records began in 1874.

Images (click to enlarge): 24-hour Mid Atlantic and Northeast precipitation, Washington/Baltimore regional storm total rainfall, both ending 8 am EDT, Oct. 1, 2010; From National Weather Service

Thursday, September 30, 2010

East Coast Flooding From "Not-Nicole" Spreads Northward

As noted in the update to the previous post, the rain has finally ended in Wilmington NC, but the flooding from excessive rainfall fed in part by the moisture from what was formerly Tropical Storm Nicole is spreading northward. Here are some highlights from the Mid Atlantic and Northeast posted in The Weather Channel's twitch stream, arranged from south to north:
  • Reports of fire dept. rescues in New Bern, NC.
  • 32 streets reported flooded in the town of Ahoskie, NC.
  • Route 5 is now closed in Great Mills, MD. Numerous intersections remain closed in Fairfax County, VA.
  • Numerous Baltimore Co. closures due to flood including Route 40 in Catonsville Hts. More rain approaching.
  • Over 5" of rain triggered small-stream flood causing Millersville Univ. to close for the day. Downed trees also.
  • Widespread street flooding, with roads closed reported in Tremont, PA.
  • Already a top 10 wettest day on record in Allentown, PA (4.33").
  • NWS has adjusted downward the flood crest forecast for the Schuylkill @ Philadelphia to 14'. Would be highest since Floyd '99.
  • No travel advised due to numerous flooded roads in Cortland County, NY. Reports of evacuations in McGraw.
  • Flood becoming serious in central NY. Many roads covered by 6-12 inches of water in Rome, NY.
Image (click to enlarge): U.S. composite satellite image at 8 pm EDT, September 30, 2010 shows moisture streaming northward from the tropics over the Mid Atlantic coast and into the Northeast, from SSEC/University of Wisconsin.

Seasonal Outlook

Latest seasonal forecast: Click here.


Latest 3-month temperature outlook from Climate Prediction Center/NWS/NOAA.