Saturday, December 31, 2011

Washington Temperature Update: Late December Surge Ties for 6th Warmest

A warm surge which exceeded expectations in the past 5 days has pushed the Washington December average temperature to a tie for the 6th warmest in 141 years of climate history. Although it was well below the record of 70° set in 1965, today's high of 62° was 8° above the forecast from Monday and 18° above the climatological average. The morning low of 46° was 17° above its average and 2° above the average daily high. In contrast to the high, which was 8° from the daily record, the low was a whopping 59° away from the record of -13° set in 1880. The daily departure of 18° above average was the largest of the month and the 9th double-digit departure this December. There were 8 days in the month which had temperatures of 60° or higher.

Images (click to enlarge): Top 11 warmest Decembers in Washington DC; CapitalClimate chart from National Weather Service data, background image © Kevin Ambrose (www.weatherbook.com)

Thursday, December 29, 2011

2011 Weather Review: Mind-Boggling Extremes

NOAA's Kathryn Sullivan and Weather Underground's Jeff Masters discuss the year's weather extremes and the climate implications on the PBS News Hour Wednesday evening, December 28:

Watch How 2011 Became a 'Mind-Boggling' Year of Extreme Weather on PBS. See more from PBS NewsHour.

Tuesday, December 27, 2011

Chicago Precipitation Update: 2011 Second Wettest Year

The 0.06" of rainfall through 4 pm today pushes the Chicago year-to-date rainfall to 49.41", exceeding the previous second highest annual total recorded in 1983.

Third Warmest Christmas on Record in UK


The Beeb reports that Christmas 2011, the mildest in 90 years, was the third warmest in history for the UK. The highest temperature of 15.1°C was actually reported in the north, at Dyce, Scotland.

For a full video report, click here.

Monday, December 26, 2011

Yet Another Top-10 Warmest Year for Washington;
2011 To Rank 4th Highest in 141-Year Heat Parade

A balmy December is combining with the hottest month ever recorded to close out 2011 as the 4th warmest in Washington DC climate records dating back to 1871. Based on the December average so far of 45.1°, which is 4.7° above the 1981-2010 baseline, the yearly average of 59.9° will edge out 2010 by 0.1° to take the 4th position in the Washington annual heat parade.

Bumping 2006 into the 11th position, this year will take its place as the 5th year out of the last decade to be in the top 11 of all time. Three of the top 6 warmest years have now occurred in the 8 years beginning with 2004.

Projected temperatures for the remainder of this week, while above the seasonal average, will likely lower the monthly mean to 44.6°, but that will not be enough to change the yearly average. The projected average would make this month the 7th warmest December in history.

Indications for rest of winter?

As reported here 6 years ago, December temperatures are virtually uncorrelated with January's in Washington. However, looking just at the warmest Decembers, there is some indication that seasonal snowfall is likely to be below average. For the previous 10 warmest Decembers, the average total seasonal snowfall was 12.5", compared with a 1981-2010 average of 14.5". Only 3 out of the 10 seasons were above average. The highest was 27.6" in 1982-1983. Note, however, that 6.6" of that had already fallen in December, compared with a trace this year; the remainder occurred in February.

Images (click to enlarge): Top 10 warmest years and warmest Decembers in Washington DC; Total seasonal snowfall following warmest Decembers in Washington; CapitalClimate charts from National Weather Service data, background images © Kevin Ambrose (www.weatherbook.com)

Saturday, December 24, 2011

The Quest for Energy: Good News and Bad News

The good news: There's plenty of oil.
The bad news: We're going to burn it all.
Author Daniel Yergin discusses his book The Quest on the PBS News Hour; unlike in some previous interviews, the subject of climate is actually raised:

Watch Author Daniel Yergin on U.S. Need for a 'Diversified Energy Portfolio' on PBS. See more from PBS NewsHour.

Thursday, December 22, 2011

Pre-Christmas Heat Update: Records Set in NY, NJ, PA, DE, MD, VA

Preliminary data from the National Climatic Data Center show that at least 13 major daily high temperature records were set or tied yesterday from Virginia to New York (alphabetically by state):
                                    Previous         Period of
Location Record Date Record (yr)
DE WILMINGTON NEW CASTLE (KILG) 62 58 12/21/1949 67
NJ ATLANTIC CITY INTL AP (KACY) 63 61 12/21/1973 64
NJ NEWARK INTL AP (KEWR) 62 61 12/21/1957 76
NJ MILLVILLE MUNI AP (KMIV) 61 60 12/21/1990 61
NY NY CITY CNTRL PARK (KNYC) 62 62 12/21/1923 135
NY NEW YORK LA GUARDIA AP (KLGA) 61 59 12/21/1993 63
NY NEW YORK JFK INTL AP (KJFK) 59 57 12/21/1957 63
NY WESTCHESTER CO AP (KHPN) 59 57 12/21/2002 49
PA PHILADELPHIA INTL AP (KPHL) 63 59 12/21/1990 70
PA MIDDLETOWN HARRISBG AP (KMDT) 59 59 12/21/1998 67
PA DUBOIS FAA AP (KDUJ) 54 54 12/21/1988 44
PA BRADFORD RGNL AP (KBFD) 53 51 12/21/1988 54
VA WASHGTN DULLES INTL AP (KIAD) 61 60 12/21/1998 49
As previously noted, a record was also set at Baltimore.

The total number of daily low temperature records set or tied in all 50 states yesterday: 1.

Wednesday, December 21, 2011

Pre-Christmas Warmth Breaks Mid-Atlantic Temperature Records


Image (click to enlarge): Surface temperature at 11 pm EST, December 21, 2011, from Unisys

Southerly winds ahead of a strong storm system have broken daily temperature records from Virginia to New York this evening. At Kennedy Airport, New York the previous record high for December 21 was 56° in 1973, but the 11 pm temperature is 57°, where it has been for the last 2 hours. Other preliminary records set or tied (previous records in parentheses) include:
LaGuardia NY          61° (59°, 1993 and 1973)
Atlantic City NJ 63° (62°, 1923)
Reading PA 61° (tie, 1923)
Washington Dulles VA 61° (60°, 1998 and 1971)
Baltimore/BWI MD 63° (61°, 1956 and 1885)
Earlier this evening, the temperature at Central Park, New York, where records began in 1869, reached at least 61°, but the record high there was 62° in 1923.

Wednesday, December 14, 2011

Record Daily Rainfall Pushes Chicago Toward 2nd Wettest Year

December 15 Update: Yesterday's final rainfall total of 1.43" exceeded the old daily record at Chicago by over 40%. The monthly total to date, including an additional 0.02" today, brings the annual amount to 49.20", only 0.15" below the second highest on record.

Original post:
Today's heavy rainfall at Chicago set a daily record for December 14 and pushed the annual total closer to the second wettest year in 140 years of records. The 1.13" reported in the preliminary daily summary as of 4 pm CST exceeded the 0.99" first observed in 1907 and tied in 1975. The year to date total of 48.88" is 36% above the normal amount of 35.83". This is the third highest annual total, behind:
1) 2008   50.86"   
2) 1983 49.35"
The 1.35" at Peoria also exceeded the daily record of 1.14" in 1975. The year to date total there of 39.12", however, is behind the 41.29" last year.

The 0.5" of snow so far this month at Chicago is well below the average amount of 3.3". Last year at this time, the monthly total was 6.9". Temperatures so far in December have averaged 4.2° above normal.

Thursday, December 8, 2011

Precipitation Records Broken Tennessee to New England


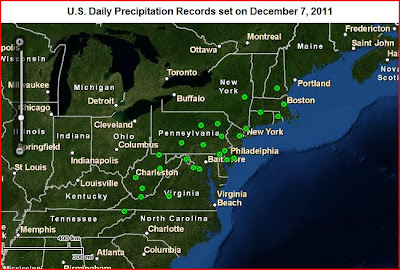
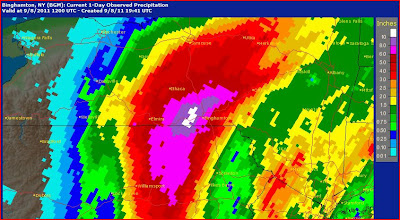
Images (click to enlarge): 24-hour precipitation ending 7 am EST, December 8, 2011, from National Weather Service; Locations of daily precipitation records, December 7, 2011, from National Climatic Data Center

In addition to the all-time cold-season (November-March) daily rainfall record set at Washington, DC, records were also broken at 25 other major reporting locations (ASOS stations) on December 7. According to preliminary data from the National Climatic Data Center, the following new daily rainfall records were set from Tennessee to New England (alphabetical by state, amounts in inches):
State Location                        New     Old     Date   Years of Record
CT HARTFORD (KBDL) 2.05 1.8 12/7/1976 69
DE WILMINGTON NEW CASTLE (KILG) 1.94 1.09 12/7/1976 69
MA BOSTON (KBOS) 1.6 1.15 12/7/1959 91
NH CONCORD ASOS (KCON) 1.52 1.2 12/7/1976 90
NJ MILLVILLE MUNI AP (KMIV) 2.46 1.94 12/7/1971 64
NJ NEWARK INTL AP (KEWR) 1.9 1.26 12/7/1996 76
NJ ATLANTIC CITY INTL AP (KACY) 1.55 1.46 12/7/1971 64
NY WESTCHESTER CO AP (KHPN) 1.55 1.45 12/7/1976 62
NY ALBANY INTL AP (KALB) 1.43 0.88 12/7/1976 73
PA PHILADELPHIA INTL AP (KPHL) 2.04 1.14 12/7/1996 70
PA ALLENTOWN AP (KABE) 1.72 1.54 12/7/1976 63
PA WILLIAMSPORT RGNL AP (KIPT) 1.55 1.37 12/7/1976 63
PA WILKES-BARRE INTL AP (KAVP) 1.32 1.04 12/7/1976 62
PA ALTOONA FAA AP (KAOO) 1.31 1.04 12/7/1976 62
PA MIDDLETOWN HARRISBG AP (KMDT) 1.25 0.95 12/7/1959 76
RI PROVIDENCE (KPVD) 1.55 1.43 12/7/1976 69
TN BRISTOL AP (KTRI) 1.46 1.25 12/7/1957 63
VA WASHINGTON REAGAN AP (KDCA) 3.1 1.34 12/7/1971 75
VA WASHGTN DULLES INTL AP (KIAD) 2.14 1.13 12/7/1976 49
VA LYNCHBURG INTL AP (KLYH) 1.8 1.13 12/7/1976 81
WV ELKINS RANDOLPH CY AP (KEKN) 1.8 1.35 12/7/1957 85
WV BLUEFIELD MERCER CO AP (KBLF) 1.71 0.72 12/7/1996 52
WV BECKLEY RALEIGH CY AP (KBKW) 1.66 0.85 12/7/1971 48
WV MARTINSBURG E WV RGNL AP (KMRB) 1.46 1.05 12/7/1976 85
WV CHARLESTON YEAGER AP (KCRW) 1.3 0.89 12/7/1950 63
WV MORGANTOWN HART FLD (KMGW) 1.11 0.95 12/7/1976 66
In addition to the Washington, DC record, the Bluefield report is also an all-time December daily record.

Wednesday, December 7, 2011

Rainfall Sets Mid-Atlantic Records;
Update: Wettest December Day in History

1 AM Update: The final record-breaking total daily rainfalls:
Washington National 3.10" (1.34", 1971)
Washington Dulles 2.14" (1.13", 1976)
Baltimore/BWI 2.38" (1.27", 1976)
The Washington National amount exceeded the normal monthly precipitation of 3.05" for December.

10 PM Update: With 0.14" more rain in the past hour, the daily total is unofficially over 3" for the first time in ANY MONTH from November through March! Here are the previous daily records for each month:
Nov 2.95" 1943
Dec 2.81" 1977
Jan 2.77" 1915
Feb 2.29" 1896
Mar 2.79" 1881
9 PM Update: Washington National has now had just under 1" of additional rainfall since 4 pm, bringing the total to 2.91". This is now unofficially the wettest December day since precipitation records began in 1871, exceeding the old record of 2.81" on December 18, 1977.

Original post:
Cold-season precipitation extremes tend to be lower than those in warmer seasons because cold air holds less moisture than warm air. With heavy rainfall still falling, however, daily precipitation records for December 7 have already been set as of 4 pm in the Mid Atlantic area. Current totals (old records in parentheses):
Washington National 1.93" (1.34", 1971)
Washington Dulles 1.33" (1.13", 1976)
Baltimore/BWI 1.18" (1.27", 1976)
Note: The Baltimore record was easily exceeded by the 0.54" which fell in the next 3 hours.

Monday, December 5, 2011

U.S. Fall Heat Records Decline From Summer's Torrid Pace;
2011 Ratio to Date Nearly 3 to 1

Following summer's spectacular pace of over 11 daily heat records for every cold record in the U.S., the ratio for meteorological autumn (September-November) declined to 1.8 to 1. While November's ratio of 1.7 to 1 was well below the August peak of 22.2 to 1, it was the 11th consecutive month in which heat records exceeded cold records. December 2010 was the only month since February of last year in which cold records outnumbered record highs. For the year 2011 to date, the cumulative ratio is 2.9 to 1, vs. 2.3 to 1 for 2010.

Preliminary NOAA/NCEP data show that fall temperatures averaged above the new 1981-2010 base period over much of the U.S., particularly along the northern border and into Canada. Temperatures averaged at least 2°C above normal across the northern Plains and northern New England. The only significant area of below average temperatures was in parts of the Southeast, including Georgia, Alabama, southern Mississippi, southern South Carolina, and northern Florida.

More details on November's temperatures should be available later this week when the National Climatic Data Center issues its State of the Climate National Overview.

Images (click to enlarge):
- Monthly ratio of daily high temperature to low temperature records set in the U.S. for November 2010 through November 2011 and seasonal ratio for summer and fall 2011, data from NOAA National Climatic Data Center, background image © Kevin Ambrose (www.weatherbook.com). Includes historical daily observations archived in NCDC's Cooperative Summary of the Day data set and preliminary reports from Cooperative Observers and First Order National Weather Service stations. All stations have a Period of Record of at least 30 years.
- U.S. September-November 2011 temperature departure from climatological average from NOAA/NCEP via ESRL

Wednesday, November 9, 2011

Alaska Megastorm Update III: Winds as High as 85 mph, 40-Foot Waves Reported


Images (click to enlarge): Water levels and wind speeds through 12:00 AKST, November 9, 2011 at Nome, Alaska; Peak wind gusts along western Alaska coast through 8 am AKST, November 9, 2011, from National Weather Service


The National Weather Service reported that wind gusts as high as 85 mph were observed from the Bering Sea storm at Tin City, Alaska. The maximum gust at Wales was 84 mph. Waves as high as 40 ft. were reported in the Bering Sea.

The storm moved over the northeastern tip of Russia early this morning with a minimum barometric pressure of 946 mb., heading into the Chukchi Sea. This makes it "one of the deepest systems in recent history to move through the Bering Sea."

Other peak wind reports (mph) include:
CAPE LISBURNE(AWOS)                   75                     
KOTZEBUE/RALPH WIEN (ASOS) 73
KIVALINA ARPT 71
POINT HOPE (AWOS) 69
CAPE ROMANZOFF (AWOS) 60
ST MICHAEL 58
TELLER 58
EMMONAK 56
NOME (ASOS) 55
BETHEL AIRPORT (ASOS) 54
SAVOONGA AIRPORT 54

Tuesday, November 8, 2011

Alaska Megastorm Update II: "Epic Magnitude" Developing

1 PM AKST Update: The latest surface weather map, from this morning, shows the major storm in the western Bering Sea with a minimum pressure of 948 mb, down 8 more millibars in the past 6 hours and 32 mb in 24 hours:


Original post:

Image (click to enlarge): Surface weather map for Alaska and northern Pacific at 12 noon GMT, November 8, 2011, from National Weather Service

A National Weather Service Special Weather Statement issued within the last hour warns of an "EXTREMELY DANGEROUS AND LIFE THREATENING STORM OF AN EPIC MAGNITUDE RARELY EXPERIENCED" for the west coast of Alaska. Over the Bering Strait coast and St. Lawrence Island, sustained hurricane force winds with gusts as high as 90 to 100 mph are predicted. Wind gusts have already been reported as high as 45 mph at Kivalina and 55 mph at Point Hope on the Chukchi Sea.

The storm moved past the western Aleutians around 3 am AKST this morning and is expected to move past the Bering Strait tonight. The surface weather map (above) from this morning shows a rapidly deepening 956 mb low of bomb proportions, down 24 mb in the past 18 hours.

From the National Weather Service:
...ALASKA WEST COAST TO BE HIT BY ONE OF THE MOST SEVERE BERING  
SEA STORMS ON RECORD...

A POWERFUL AND EXTREMELY DANGEROUS STORM OF NEAR RECORD OR
RECORD MAGNITUDE IS BEARING DOWN ON THE WEST COAST OF ALASKA.
AT 9 AM THIS MORNING THE STORM CENTER WAS LOCATED ABOUT 600
MILES SOUTHWEST OF ST LAWRENCE ISLAND. THE STORM IS FORECAST
TO MOVE RAPIDLY NORTHEAST TODAY AND TONIGHT WITH THE CENTER
MOVING ACROSS THE CHUKOTSK PENINSULA TONIGHT. ON WEDNESDAY
THE STORM WILL TAKE A NORTHWESTWARD TRACK INTO THE CHUKCHI SEA.

THE STORM WILL BRING EXTREMELY STRONG WINDS TO ALL OF THE
ALASKA WEST COAST BEGINNING THIS AFTERNOON OVER ST LAWRENCE
ISLAND AND BEGINNING THIS EVENING OVER THE REMAINDER OF
THE WEST COAST...ACCOMPANIED BY WIDESPREAD MAJOR COASTAL
FLOODING AND SEVERE BEACH EROSION OVER MANY PARTS OF THE
COASTLINE. THE WIND WILL PUSH LARGE AMOUNTS OF WATER INTO NORTON
SOUND...RAISING SEA LEVELS TO 7 TO 9 FEET ABOVE NORMAL IN NORTON
SOUND AND ALONG THE BERING STRAIT COAST. THE EXTREMELY STRONG
WINDS WILL PRODUCE HIGH WAVES WHICH WILL PUSH THE HIGH WATER
FARTHER INLAND.

OVER THE BERING STRAIT COAST AND ST LAWRENCE ISLAND...
SUSTAINED WINDS ARE EXPECTED TO REACH 75 MPH WITH MAXIMUM
GUSTS OF 90 TO 100 MPH. ALONG THE CHUKCHI COAST...WIND
SPEEDS OF 65 TO 70 MPH WITH GUSTS AS HIGH AS 90 MPH ARE
EXPECTED. IN THE NOME AREA...SUSTAINED WINDS AS HIGH AS
60 MPH ARE EXPECTED...WITH GUSTS TO 70 MPH. ALMOST ALL OTHER
AREAS OF THE WEST COAST WILL EXPERIENCE MAXIMUM WIND SPEEDS
OF AT LEAST 50 TO 60 MPH.

...THIS WILL BE EXTREMELY DANGEROUS AND LIFE THREATENING
STORM OF AN EPIC MAGNITUDE RARELY EXPERIENCED. ALL PEOPLE
IN THE AREA SHOULD TAKE PRECAUTIONS TO SAFEGUARD THEIR LIVES
AND PROPERTY.

Monday, November 7, 2011

Alaska Megastorm Update I: Hurricane Force Winds Predicted

Image (click to enlarge): The latest (8:30 pm GMT, November 7) satellite image shows an intensifying storm moving away from northern Japan and east of the Kamchatka Peninsula as it approaches the Bering Sea, from SSEC, University of Wisconsin

3:30 PM AKST Update: The National Weather Service is calling for this to be "one of the most severe Bering Sea storms on record":
A RAPIDLY DEVELOPING STORM LOCATED ABOUT 600 MILES SOUTHWEST  
OF SHEMYA THIS AFTERNOON WILL INTENSIFY INTO ONE OF THE
MOST SEVERE BERING SEA STORMS ON RECORD AS IT MOVES NORTHWARD
ACROSS THE CHUKOTSK PENINSULA TUESDAY NIGHT. THIS STORM
HAS THE POTENTIAL TO PRODUCE WIDESPREAD DAMAGE.

THE STORM WILL PRODUCE WIDESPREAD WINDS OF 40 TO 55 MPH
WITH HIGHER GUSTS OVER THE WEST COAST TUESDAY NIGHT INTO
WEDNESDAY EVENING. STRONG WEST WINDS ARE EXPECTED TO CONTINUE
OVER ST LAWRENCE ISLAND WEDNESDAY NIGHT. GUSTS TO 70 MPH CAN BE
EXPECTED ALONG THE CHUKOTSK PENINSULA AND IN AREAS NEAR KOTZEBUE.
WINDS OF 60 TO 75 MPH ARE EXPECTED OVER ST LAWRENCE ISLAND AND
THE BERING STRAIT COAST. WINDS ARE EXPECTED TO APPROACH HURRICANE
FORCE OVER THE CHUKCHI SEA AND NORTHERN BERING SEA. THE STRONG
WINDS WILL GENERATE SEAS TO AS HIGH AS 20 FEET OVER THE CHUKCHI
SEA...AND TO 15 TO 25 FEET OVER THE NORTHERN BERING SEA.

THE STRONG WINDS WILL PUSH LARGE AMOUNTS OF WATER INTO NORTON
SOUND...RAISING SEA LEVELS TO AS HIGH AS 8 TO 9 FEET ABOVE NORMAL
TUESDAY NIGHT THROUGH WEDNESDAY NIGHT. THE HIGH SEA LEVELS
COMBINED WITH HIGH WAVES WILL PRODUCE SEVERE BEACH EROSION AND
MAJOR COASTAL FLOODING ALONG THE NORTHERN AND EASTERN SHORES OF
NORTON SOUND AND ALONG THE BERING STRAIT COAST. HIGH WATER
LEVELS WILL PRODUCE COASTAL FLOODING ALONG THE SOUTHERN
SHORE OF NORTON SOUND. STRONG WINDS AND WAVE ACTION MAY PUSH
ICE IN NORTON BAY ON SHORE.

MODERATELY ELEVATED SEA LEVELS AND HIGH WAVES WILL CAUSE
SEVERE BEACH EROSION AND MAJOR COASTAL FLOODING ALONG THE
SOUTH AND WEST FACING COASTS OF ST LAWRENCE ISLAND TUESDAY
THROUGH WEDNESDAY NIGHT.

ALONG THE CHUKCHI SEA COAST FROM CAPE KRUSENSTERN NORTHWEST...
SOUTHEAST WINDS GUSTING TO A HIGH AS 70 MPH WILL PRODUCE HIGH
WAVES AND SOME ELEVATION OF SEA LEVELS...RESULTING IN SEVERE
BEACH EROSION AND MAJOR COASTAL FLOODING. THE VILLAGE OF
KIVALINA WILL BE HIGHLY VULNERABLE TO DAMAGE CAUSED BY
BEACH EROSION AND COASTAL FLOODING.

THE STORM WILL ALSO PRODUCE SIGNIFICANT SNOWFALL AND BLIZZARD
CONDITIONS OVER ALMOST ALL OF THE WEST COAST TUESDAY NIGHT
AND WEDNESDAY. SNOWFALL AMOUNTS OF AS MUCH AS 14 INCHES
ARE EXPECTED ALONG THE SOUTHERN SEWARD PENINSULA COAST AND
IN PARTS OF THE INTERIOR SEWARD PENINSULA.

AGAIN...THIS IS AN EXTREMELY DANGEROUS AND LIFE THREATENING
STORM WHICH WILL BE ONE OF THE WORST ON RECORD OVER THE BERING
SEA AND THE WEST COAST.
Original Post:
This morning's forecast discussion from the National Weather Service notes that the storm developing in the northern Pacific has been well predicted so far by both the U.S. GFS model and the European model. The models have also been consistent from one run to the next. Winds are forecast to be locally as high as 75 mph along the Alaskan coast. Although the water level may not reach the record height of 1974, the potential for severe coastal damage is very high because of the lack of sea ice. From the NWS forecast discussion:
THE STRONGEST WINDS ARE EXPECTED TO BE SOUTH 75 MPH NEAR SAVOONGA  
AT THE HEIGHT OF THE STORM ON TUESDAY NIGHT. SAVOONGA IS A
SINGULAR POINT WITH STRONG SOUTH WINDS BECAUSE ATUK
MOUNTAIN...SUMMIT ELEVATION 2207 FEET...IS JUST SOUTH OF THE
VILLAGE.

THE STORM IN THE BERING SEA TUESDAY AND WEDNESDAY IS REMARKABLY
SIMILAR TO THE BERING SEA STORM OF NOVEMBER 11 AND 12 1974. THE
1974 STORM REMAINS THE MOST SEVERE AT NOME IN 113 YEARS OF
RECORDS THERE. THE CREST AT NOME WAS A 13.2 FOOT RISE IN STATIC
WATER LEVEL ABOVE MEAN SEA LEVEL. THE CREST THIS TUESDAY NIGHT
AND WEDNESDAY AT NOME IS EXPECTED TO BE 10 FEET.

DUE TO A STRONG SOUTHERLY INFLUX OF WARMER AIR OVER THE BERING SEA
COAST STARTING LATE TONIGHT...BLIZZARD CONDITIONS ARE NOT EXPECTED
AROUND THE ZONES OF THE YUKON DELTA AND NORTON SOUND COASTAL
ZONES. HENCE...WINTER STORM WARNINGS FOR HEAVY SNOW ARE IN EFFECT
FOR THOSE AREAS.

INDEED...THE SNOW ON SAINT LAWRENCE ISLAND WILL BE MIXED WITH
RAIN TUESDAY AND TUESDAY NIGHT. A HIGH WIND WARNING IS IN EFFECT
FOR SAINT LAWRENCE ISLAND AND THE BERING STRAIT COAST.
A Public Information Statement from Fairbanks says, in part:
ALL SOUTH AND WEST FACING COASTS ON THE BERING SEA FROM THE YUKON  
DELTA UP TO BERING STRAIT...AND THE CHUKCHI SEA COAST NORTH OF
KOTZEBUE UP TO POINT HOPE...ARE EXPECTED TO HAVE MAJOR COASTAL
FLOODING AND BEACH EROSION TUESDAY NIGHT AND WEDNESDAY. SOUTHERLY
WINDS FROM 40 TO 75 MPH ARE FORECAST TO DRIVE UP THE SEA FROM 4 TO
10 FEET ABOVE NORMAL LEVELS. THE STRONGEST WINDS AND COASTAL
FLOODING WILL SPREAD OVER THE NORTHERN BERING SEA TUESDAY NIGHT
AND THEN OVER THE CHUKCHI SEA COAST ON WEDNESDAY. THE STORM WILL
SUBSIDE THURSDAY.

NEARLY ALL OF THE ALASKAN NORTHWEST COAST REMAINS ICE FREE AS OF
TODAY...AND THIS WILL NOT CHANGE FOR SOME TIME. KOTZEBUE SOUND AND
NORTON BAY ARE ICE COVERED. LARGE STRETCHES OF NORTHWEST ALASKA
COASTLINE HAVE VIRTUALLY NO ICE COVER TO LESSEN THE IMPACT OF
INCOMING SURF. THIS WAS NOT SO IN THE 1974 STORM.

THIS IS A DANGEROUS STORM. ALTHOUGH IT MAY NOT TURN OUT TO BE AS
INTENSE AS THE 1974 STORM...IT HAS THE POTENTIAL TO CAUSE
WIDESPREAD DAMAGE.

Sunday, November 6, 2011

Indirect Effects: Arctic Ice Loss Has Immediate Consequences


Images (click to enlarge): Arctic sea ice extent, November 5, 2011, from National Snow and Ice Data Center; GFS model forecast weather map for northern Pacific and Alaska, November 9, 2011, from NCEP/National Weather Service.

See update for later information.

Original post:
Although it didn't quite break the record low of 2007, this year's minimum Arctic ice extent was the second lowest since satellite observations began in 1979. If current forecasts work out as expected, however, this near-miss is likely to have drastic consequences for the northwest coast of Alaska. This morning's northern Alaska forecast discussion from the National Weather Service Fairbanks office describes the potential impact of a very strong storm developing in the northern Pacific and headed across the Aleutians into the Bering Sea early this week (h/t Stu Ostro):
LOW NUMBER 2 IS REMARKABLY SIMILAR TO THE STORM THAT CAUSED MAJOR  
COASTAL FLOODING ON THE NORTHWEST ALASKA COAST ON NOVEMBER 11 AND
12 IN 1974. THE ONLY DIFFERENCE OF ANY NOTE IS THAT THE 1974 STORM
CENTER CROSSED THE ALEUTIANS NEAR THE INTERNATIONAL DATE LINE.
THIS NOVEMBERS STORM IS DUE TO CROSS THE ALEUTIAN CHAIN AT ITS
WEST END ON TUESDAY MORNING. THIS NOVEMBERS STORM IS FORECAST TO
REACH BERING STRAIT WEDNESDAY MORNING. THE 1974 STORM ALSO ENDED
UP AT BERING STRAIT. IN A FEW WORDS...THE ORIGINS AND PATHS OF
THESE STORMS ARE SLIGHTLY DIFFERENT...BUT THEIR DESTINATIONS ARE
THE SAME.

THE OCEAN TIDES ALONG THE NORTHWEST ALASKA COAST THIS WEEK ARE AT
AVERAGE LEVELS. THE OCEAN TIDES AT THE TIME OF THE 1974 STORM WERE
AT MOST A FOOT OR TWO ABOVE THIS YEARS. HENCE...THIS IS A MINOR
FACTOR. IN THE 1974 STORM...THE WIND DRIVEN RISE IN SEA LEVEL WAS
CLOSE TO 10 FEET.

IN THE 1974 STORM THERE WAS CONSIDERABLE SEA ICE IN NORTON
SOUND. THE SOUTHEAST CHUKCHI SEA...FROM BERING STRAIT UP TO
BARROW INCLUDING KOTZEBUE SOUND...HAD EXTENSIVE ICE COVER DURING
THE 1974 STORM. THIS YEAR THERE IS ONLY A SMALL AREA OF SHORE ICE
IN EASTERN NORTON SOUND. ON THE CHUKCHI SEA COAST THERE IS ONLY A
NARROW STRETCH OF ICE...LESS THAN 10 MILES WIDE...FROM BERING
STRAIT TO POINT HOPE. KOTZEBUE SOUND IS 50 TO 70 PERCENT ICE
COVERED. ALL OF THIS MEANS IS THAT THERE WILL BE VERY LITTLE SHORE
ICE TO PROVIDE SOME PROTECTION TO THE COAST.

THE COASTAL FLOODING IN THE 1974 STORM BEGAN AT MID DAY IN NORTON
SOUND...AND TOWARD EVENING IN KOTZEBUE SOUND. IF LOW NUMBER 2
FOLLOWS THE SCRIPT OF THE FORECAST MODELS...THE COASTAL FLOODING
WITH THIS YEARS STORM WOULD BEGIN IN NORTON SOUND ON TUESDAY
EVENING...AND ALONG THE CHUKCHI SEA COAST FROM BERING STRAIT TO
POINT HOPE ON TUESDAY NIGHT.

THE LATEST GFS MODEL FORECASTS INDICATE A SHARP CHANGE IN THE
WIND OVER NORTON SOUND ON WEDNESDAY MORNING...SHIFTING FROM
SOUTHEAST TUESDAY NIGHT TO SOUTHWEST WEDNESDAY MORNING. IF THE
OUTCOME ON WEDNESDAY FOLLOWS THIS FORECAST...THERE WOULD BE
ADDITIONAL COASTAL FLOODING ON THE YUKON DELTA AND IN EASTERN
NORTON SOUND.

LOW NUMBER 2 IS GOING TO BE A DANGEROUS STORM.
The top image shows the Arctic ice extent as of yesterday, November 5. The southern edge is well north of the northern coast of Alaska, leaving the Bering Sea, Norton Sound, and Chukchi Sea along Alaska's west coast ice-free.

The second image shows an output weather map from the main U.S. global forecast model, the GFS. It is a 60-hour forecast for 6 am GMT on Wednesday, November 9. A very strong storm with a minimum pressure of 940 mb is centered in the Bering Sea, moving toward the Bering Strait and pounding the west coast of Alaska with dangerously high winds.

The sea ice extent doesn't need to set a new record in order to have serious consequences.

Monday, October 31, 2011

More October Snowfall Records Reported

Image (click to enlarge): October daily snowfall records broken ("X") or tied on October 30, 2011, from National Climatic Data Center

The number of all-time October daily snowfall records set on October 29 has now increased to 27. In addition to the records previously reported are the following (previous record in parentheses):
Hartford CT     12.3" (1.7", 1979-10-10)
Bridgeport CT 3.5" (0.5", 1987-10-04)
Worcester MA 11.4" (7.5", 1979-10-10)
Concord NH 13.6" (2.1", 1969-10-22)
An additional 69 records were reported broken yesterday (October 30). These were primarily cooperative reporting stations, but the official station at Portland, Maine reported a new record of 5.2", vs. the old record of 3.6" (1969-10-22) in a 91-year snowfall history.

Sunday, October 30, 2011

October Snow: Historical Context

The current October snowfall in the northeastern U.S. has certainly been impressive, particularly in the areal extent, but the historical record shows that autumn snowstorms were both earlier and more frequent in the mid-19th century. In his definitive history, "Early American Winters", David Ludlum lists records of early season snowfalls in 21 of the 50 years from 1821 to 1870, including many in September and several in late August. The mid-1830's were particularly prolific, with 3 events before the middle of October in 1836, including at least "some snow" as far south as South Carolina.

1821: Oct. 25-26, Salem MA: "sufficient to cover the ground"

1823: Sept. 29, Worcester County MA: "snow in several parts of the county"

1829: Sept. 3, Sherburne VT: "an inch and a half deep"

1832: Aug. 25-26, New Hampshire: "White Mountains covered by snow apparently several inches deep"

1833: Oct. 30, Somerset PA: "Two inches snow, the fourth fall of the autumn"
Oct. 29-30, Philadelphia PA: "Houses whitened by snow"

1835: Sept. 30, northern New England: 6-12" in Franklin County, Vermont; 6" at Kilkenny New Hampshire

1836: Sept. 28: Hamilton NY 4", Bridgewater NY 3", Rochester NY 1"
October 5-6: Onondaga County NY 2 feet, Auburn NY 24-26" Cortland NY 18", Hollidaysburg PA 26", Sideling Hills MD 10", Loudoun County VA 5", Yorkville SC "some snow"
October 11-12: Hamilton NY 35" "measured as it fell", Madison NY 12", Bridgewater NY 18", Oxford NY 12"

[More reports to be added later]

Early-Season Snow Sets Mid-Atlantic October Records

Image (click to enlarge): Storm total snowfall ending 10 am EDT, October 30, 2011, from National Weather Service


October 31 Update: Snow totals updated with final reports from National Weather Service. The highest reported amount was 32" at Peru, Massachusetts.

11 AM Update: The Weather Channel is reporting via tweet that Jaffrey NH had a storm total of 31.4". A National Weather Service report has increased the Plainfield MA amount to 30.8".

Original Post:
What was little more than a very heavy frost in the Washington, DC metro area yesterday set some all-time October daily snowfall records at higher elevations and north of the Mason-Dixon line. Preliminary data indicate that 20 October daily records were set from West Virginia through New York. Among the major reporting locations, New York's Central Park had the longest period of record (135 years), with the 2.9" smashing the previous record of 0.8" on October 30, 1925. It was therefore the first time that over 1" of snow had been observed in Central Park in October. Other October daily records included (previous record in parentheses):
Newark NJ       5.2" (0.3", 1952-10-20)
La Guardia NY 1.7" (1.2", 1962-10-26)
Kennedy NY 1.5" (Trace, 2002-10-30)
Islip NY 0.3" (0.0")
Harrisburg PA 9.7" (Trace, 1965-10-28)
Wilkes-Barre PA 9.1" (4.4", 1962-10-26)
Allentown PA 6.8" (1.2", 1972-10-19)
The largest amounts of snow from this storm were in the Berkshires of western Massachusetts, where totals of 2 feet or more were reported; the highest was 27.8" at Plainfield. The highest amounts reported by the National Weather Service by state through Sunday, October 30, included:
...CONNECTICUT...
BAKERSVILLE 18.6
WINSTED 18.0
DANBURY 17.2
BRISTOL 17.0
LITCHFIELD 16.5
RIDGEFIELD 15.5
THOMASTON 13.5
WINCHESTER CENTER 13.5
NEW PRESTON 12.8
OXFORD 12.3
NORTH CANAAN 12.0

...MASSACHUSETTS...
PERU 32.0
PLAINFIELD 30.8
WINDSOR 26.0
ASHFIELD 25.5
GOSHEN 25.0
TOLLAND 2 S 25.0
BUCKLAND 24.0
HEATH 24.0
SAVOY 24.0
WORTHINGTON 24.0
TYRINGHAM 23.0
BECKET 5.6 SSW 22.6
BLANDFORD 22.0
LEYDEN 22.0
ROYALSTON 22.0
TEMPLETON 22.0
WASHINGTON 22.0
WORCESTER 14.6
BOSTON 1.0

...MARYLAND...
FROSTBURG 1 N 11.6
SABILLASVILLE 11.5
FROSTBURG 9.5
THURMONT 6 W 8.5
ELDERSBURG 2 NW 7.8
SMITHSBURG 3 NE 7.3
MANCHESTER 5 NW 7.0
REDHOUSE 7.0
WOLFSVILLE 7.0
WOODLAND 1 W 7.0

...MAINE...
ACTION 1 N 20.0
BRIDGTON 17.4
NEWFIELD 4.0 WSW 17.0
CORNISH 1 SSW 14.8
OTISFIELD 1 W 14.0
GRAY NWS OFFICE 12.9
PARIS 4 E 12.0
S CASCO 11.0
WATERVILLE 2.5 NNE 11.0
HOLLIS 9.8
VAUGHAN WOODS 2 ESE 9.0
PORTLAND 5.1 NW 6.5

...NEW HAMPSHIRE...
JAFFREY 31.4
BOW 1.6 NW 25.8
TROY 25.0
PETERBOROUGH 24.0
WEST SWANZEY 24.0
FITZWILLIAM 23.0
CONCORD ASOS 22.2
HILLSBORO 21.5
BEDFORD 20.8
GILFORD 3 SSE 20.0
WASHINGTON 1 ESE 19.5
NORTHFIELD 19.1
MERRIMACK 19.0
NORTH PEMBROKE 2 E 19.0

...NEW JERSEY...
WEST MILFORD 19.0
LAKE HOPATCONG 17.0
SPARTA 16.8
ROCKAWAY TWP 0.7 NE 16.6
MARCELLA 16.4
ROCKAWAY 16.4
LONG VALLEY 16.0
RANDOLPH TWP 0.8 W 14.5
HARDYSTON TWP 3.2 SE 14.1
NEWARK 5.2

...NEW YORK...
MILLBROOK 21.6
BLOOMINGBURG 2 SW 17.7
YANKEE LAKE 16.5
HARRIMAN 16.0
HOPEWELL JUNCTION 2.4 SSE 14.8
WOODRIDGE 5.5 S 13.6
TAGHKANIC 13.1
COPAKE FALLS 13.0
ARMONK 12.5
MILLWOOD 12.4
HIGHLAND MILLS 12.0
KENT CLIFFS 12.0
MIDDLETOWN 12.0
MONROE 12.0
SOMERS 12.0
ALBANY 1 SW 3.8
NEW YORK CENTRAL PARK 2.9

...PENNSYLVANIA...
HAZLETON 1 E 16.0
HUFFS CHURCH 16.0
SPRINGTOWN 16.0
FREELAND 1 S 14.0
TOBYHANNA 13.3
MOSCOW 13.0
WILLIAMS TWP 13.0
ARENDTSVILLE 6 NW 12.5
TOWAMENSING TWP 12.5
LAUREL SUMMIT 12.2
ALBRIGHTSVILLE 12.0
BLUE KNOB 12.0
FAYETTEVILLE 6 ENE 12.0
PHILADELPHIA 0.3

...RHODE ISLAND...
WEST GLOCESTER 6.6
NORTH FOSTER 6.5

BURRILLVILLE 4.5
GREENVILLE 4.0

...VIRGINIA...
SKYLAND 9.0
BIG MEADOWS 8.0
LINDEN 2 N 8.0
WILDE ACRES 1 N 7.4
BETHEL 2 ESE 6.5
CEDAR GROVE 2 NE 6.0
FRONT ROYAL 5.6
WINCHESTER 5.0

...VERMONT...
WEST HALIFAX 0.2 SE 16.0
BRATTLEBORO 2.0 SW 15.1
WILMINGTON 13.0
SPRINGFIELD 9.5
LUDLOW 7.0
WOODSTOCK 6.0

...WEST VIRGINIA...
MOUNT STORM 2 SSE 14.0
KIRBY 4 WNW 12.0
CHERRY GROVE 6 WSW 10.0
MOUNT PISGAH 2 E 10.0
TERRA ALTA 10.0
BLOOMERY 1 SW 8.0
FRANKLIN 4 W 8.0
SMITH CROSSROADS 1 W 7.3
CORTLAND 2 SW 6.5
ROMNEY 4 E 6.4

Saturday, October 29, 2011

Early Mid-Atlantic Snow: Seasonal Harbinger or Freak Event?

Today's remarkably early snowfall "battered" (seriously, the term used by a major media outlet) the Washington, DC metro area with widespread traces of snow. Here at the climate capitalist capitol, at least 100 meters higher than the official reporting location, there are white areas on grass and car tops. The official daily totals through 5 pm (and likely final amounts as the storm moves off to the northeast) are:
Washington National  Trace
Washington Dulles 0.6"
Baltimore BWI Trace
The National and BWI amounts tied daily records from 1925 and 1952, respectively. The Dulles amount was a record for the date. However, all 3 totals fell short, in both amount and timing, of the records set for earliest measurable snow on October 10, 1979.

If March snow is rare in Washington, October snow is even rarer. Prior to today, a trace or more of snow had been observed in only 10 Octobers since official snowfall records began in 1888. Only 3 of those had measurable amounts:
1925 2.2"
1940 1.5"
1979 0.3"
Does such early snowfall have any significance for the remainder of the season? The record says a resounding "No". The chart shows the October snowfall totals (dark blue) along with the entire seasonal amounts for each of the 10 seasons (lighter blue). Three of the snow seasons (1892-93, 1917-18 and 1957-58) had substantially above-average amounts of 30" or more. On the other hand, 3 other seasons had single-digit totals of under 7", including 1972-73, which had the lowest seasonal total on record of 0.1" (tied with 1997-98). Overall, the average of the 10 seasons with October snow was 18.9", just barely above the historical average of 18.2" for all seasons from 1888 through 2011 (green bars on the right).

Image (click to enlarge): October snowfall vs. full-season totals for Washington, DC, 1888-2011; CapitalClimate chart from National Weather Service data, background image © Kevin Ambrose (www.weatherbook.com)

Thursday, October 13, 2011

Exceptional Texas Drought Slightly Dented


Images (click to enlarge):
- Texas drought monitor for week ending October 11, 2011 from NOAA/USDA
- Weekly Texas drought conditions from July 2010 to October 2011, CapitalClimate chart from U.S. drought monitor data
- 24-hour precipitation ending 9 am CDT, October 9, 2011 from National Weather Service
- U.S. seasonal drought outlook, October 6 to December 31, 2011 from Climate Prediction Center/NWS


Long-awaited precipitation in the past week has put the first significant dent in the ongoing Texas extreme drought conditions, but 92% of the state remains in the extreme (D3) or exceptional (D4) category. Exceptional drought, the highest category, has dropped from the peak of 88% of the state last week to 73% currently.

Rainfall in the past week as high as 8" in portions of north-central Texas were as much as 6 times the normal amounts, but larger quantities over a more sustained period are needed to continue reducing the extreme drought. Some 24-hour precipitation totals through 9 am CDT, Sunday, October 9, include:
Comanche          8.30”
Dublin 6.10”
Stephenville 5.78”
Cleburne 5.53”
Mineral Wells 5.14”
Goldthwaite 5.00”
Weatherford 4.79”
Breckenridge 4.77”
Hico 4.72”
Waco Lake 4.35”
Waco Airport 4.28”
Palo Pinto 4.00”
The current drought outlook, released October 6, shows drought persisting through the end of the year in most of Texas, with the exception of some improvement in the panhandle region and adjacent areas of Oklahoma. The outlook was published before the heavy rains of the past weekend, however.

Monday, October 10, 2011

PBS Uses Slow News Day to Cover Keystone XL Pipeline

Watch the full episode. See more PBS NewsHour.


The PBS NewsHour used the slow news cycle of the Columbus Day holiday today to cover the Keystone XL pipeline issue:
A Canadian company wants to build a $13 billion, 1,700-mile pipeline to carry crude oil from the so-called tar sands region in Alberta through six states and a major aquifer to Texas for refining. Correspondent Tom Bearden reports from Nebraska on the high-stakes environmental and economic battle over the Keystone XL project.
PBS, which seems to be increasingly outsourcing its news gathering operations, presented a comment by one "JASON BERRINGER, Laborers International Union Local 1140", who said:
I worked with TransCanada before on another pipeline. And I have never had a company like them that took care of environmental issues like they have. They really care about the environment.
This would be the same Jason Berringer who was spotted in a paid pro-pipeline ad on a commercial cable news network within an hour or so of the PBS broadcast.

Speaking of outsourcing, there was no mention of the glaring conflict of interest represented by the State Dept. outsourcing the environmental review to a company with close ties to Keystone:
A few days into the demonstrations, the State Department released the final environmental impact statement on the project, a study three years in the making. It says the pipeline would carry a blend of synthetic crude oil and diluted bitumen and poses no significant impact to the environment.
In a classic example of false equivalence, the feckless reporter concludes, "Both sides accuse each other of playing fast and loose with the truth."

Sunday, October 2, 2011

Mid Atlantic Record Low Daily Maximum Temperatures Set or Tied;
Update: Washington Ties Record for 2nd Consecutive Day


Image (click to enlarge): U.S. daily high temperatures for October 2, 2011, from Unisys

October 3, Midnight Update: The National Weather Service reported today that Salisbury, Maryland also set a new record low daily maximum temperature for October 2 (Sunday). The high of 55° beat the old record of 56° in 1940. Salisbury climate records date back to 1900.

October 3, 5:30 PM Update: A late surge of sunshine could change the final result, but today's high temperature so far of 53° at Washington National is tied with the record daily low maximum from 1974. The 51° at Dulles has already missed the record of 49°, also from 1974. Baltimore has also missed the record with 56°, vs. the record of 52°, again from the same year.

October 3, 12 PM Update: The preliminary daily high temperatures are confirmed.

Original post:
Unless temperatures inexplicably jump several degrees in the next hour or so, daily record low maximum temperatures for October 2 will be set or tied at all 3 major reporting locations in the Washington/Baltimore area. The high of 58° at Richmond, however, is 4° above the daily record low maximum. The high of 56° at Philadelphia has also missed its record, which is 53° in 1899. Today's preliminary highs and the previous records for the date in parentheses from National Weather Service climate data:
Washington National 52 @ 1253 PM  (52, 1939) 
Washington Dulles 50 @ 1226 PM (54, 1974)
Baltimore BWI 51 @ 1120 AM (53, 1939)

Friday, September 30, 2011

UK Sets National Daily Heat Record for 3rd 4th Consecutive Day;
October Monthly Record in Jeopardy Also Broken

October 2 Update: The Met Office reports that today's high temperature of "29.3C at Cambridge (at 14:29 bst) and Santon Downham (at 14:43 bst)" is a new national record for October 2, exceeding the 28.1C in 1908 (unspecified location).
[Update: Location of previous record was Whitby, North Yorkshire.]

October 1, 3 PM BST Update: The October record has been exceeded by an additional 0.4°C:
The maximum daily temperature record for the UK as a whole for October has been broken with 29.9C recorded at Gravesend at 14:42 BST. The previous record value [29.4°C] was reported at March in Cambridgeshire on 1st October 1985. The Wales maximum temperature value for October has also been exceeded with Hawarden reporting 28.2C at 14:12 BST. The previous was 26.4C at Ruthin in Denbighshire (1st October 1985).
The BBC reports:
Record UK temperature for October set at 29.9C
From the Guardian:
Indian summer brings out the crowds

October 1, 2 PM BST Update: The Met Office reports that the UK October monthly high temperature record has been broken:
The maximum daily temperature record for the UK as a whole for October has been broken with 29.5C recorded at Gravesend at 13:27 BST. The previous record value was reported at March in Cambridgeshire on 1st October 1985. The Wales maximum temperature value for October has also been exceeded with Trawscoed reporting 26.6C at 12:50 BST. The previous was 26.4C at Ruthin in Denbighshire Temperature values are still rising, and this message will be updated later this afternoon.
Original post:
The Beeb reports that UK national daily heat records were set for both September 29 and 30, beating previous records, each over a century old, by as much as 2 degrees:
On Friday, Cambridge set a new record temperature for the hottest ever 30 September with 29.2C (84.5F), beating the 27.8C (82F) set in Maidenhead, Berkshire in 1908.

Kew Gardens in west London set another record on Thursday with 28.8C (83.8F) - the highest ever 29 September temperature, beating the mark of 27.8C (82F) set in York in 1895.
With unseasonably hot temperatures continuing into the weekend, the monthly record for October is also in jeopardy of breaking:
The 29.4C (84.9F) record was set at March, Cambridgeshire on 1 October 1985

BBC weather forecaster Darren Bett said there was a "good chance" the October record would be broken on Saturday.
More from the Guardian:
Weather records tumble as Britons head for the beach

Image (click to enlarge): UK forecast temperatures for 4 pm, Saturday, October 1, from Met Office

Wednesday, September 28, 2011

Minnesota Temperature Update: Record High at International Falls;
Century-Plus Records Fall in Dakotas

Midnight Update: The updated preliminary climate report shows a high temperature of 82°.

Other high temperature records in North and South Dakota were (old record in parentheses):
Grand Forks ND    88°  (85°, 1995)
Fargo ND 90° (89°, 1905)
Huron SD 93° (92°, 1897)
Mitchell SD 93° (tie, 1897)
The Huron high temperature represented a 50° swing from the morning low of 43°.

Original post:
After hitting a record September low 2 weeks ago, northern Minnesota temperatures have rebounded to summer levels. Today's high of 81° at International Falls broke the record of 80° set in 1922. With 3 days remaining in the month, the September average through yesterday remains at 0.3° above the 1981-2010 normal.

Thursday, September 15, 2011

Northern Minnesota's Coldest Temperature So Early in Season


Image (click to enlarge): Median date of first freezing temperature, from Midwestern Regional Climate Center, via National Weather Service

The low temperature of 19° this morning at International Falls, Minnesota was the coldest ever reported so early in the season and an all-time record low for September. The National Weather Service reports:
The low temperature at 7:06 am this morning at International Falls was 19 degrees. This breaks the record low for a September 15th, 24 degrees, set in 1964. This is the coldest temperature reported for so early in the season. This also marks the first time in station history that a temperature in the teens has been recorded in the month of September.
The low temperature at Embarrass also reached 19°. The low of 36° at Minneapolis tied the record for the date from 1964 and 2007. The 29° at Eau Claire broke the record of 30° from 2007. Other record lows included:
Rochester MN          31 
Prairie Du Chein WI 27
Viroqua WI 31
The record lows follow a near-record streak of 80° days at Duluth ending Monday:
Today, September 12th, marks the 5th consecutive day of an 80 degree temperature at Duluth. Only two other stretches have been as long or longer than this in the month of September. Six consecutive days above 80 is the record set in 1906, September 5-10. The other 5 day string was in 1948 from September 1-5.

Tuesday, September 13, 2011

Dallas Breaks Annual 100° Day Record;
Houston and Austin Extend Records


Image (click to enlarge): Number of 100° temperature days at Houston and elsewhere in southeastern Texas

5 PM CDT Update: The preliminary high temperature at Dallas was 107°, smashing the old daily record by 7°.

Also breaking a record by a wide margin was Houston, where the 102° high crushed the 99-year-old record of 98° from 1912. This year has now had both the earliest (June 5) and latest 102° temperatures in a calendar year at Houston. This is the 45th day of 100° temperatures at Houston, breaking the old record of 32 by almost 2 weeks.

The Austin high of 105° broke another long-standing record, exceeding the 100° in 1918. It was the 7th 100° day at Austin this month and the 84th this year, extending the record more than 2 weeks beyond the old record of 69. The record was broken on August 24.

Original post:
The Dallas temperature reached 101° at 1 pm CDT today, breaking the record for yearly number of days with 100° temperatures. The old record was 69 in 1980. This also breaks the old record high temperature for the date of 100° set in 1965. If the forecast high of 106° is reached, it will break the record by 6°.

This is also the 86th day of 100° or higher at Waco, exceeding the 1980 record of 63 days by over 3 weeks.

Friday, September 9, 2011

Lee's Leftovers Loosen Soggy Stranglehold on Mid Atlantic;
Record Rain Relinquishes Reign


Image (click to enlarge): Mid Atlantic precipitation for 7 days ending 8 am EDT, Sept. 9, 2011, from National Weather Service

After drenching the Mid Atlantic region for most of the week, the remnants of Tropical Storm Lee have finally let up their relentlessly rainy reign. Although some flash flood warnings and watches as well as river flood warnings remain in effect, the heaviest rainfall has ended, leaving behind some record-breaking accumulations. Double-digit storm totals have been recorded across at least 10 states from Louisiana to New York. The highest amount appears to be 20.96" at a cooperative station near Colonial Beach, VA, but a plume of very heavy rainfall extended northward through the Susquehanna River watershed of Pennsylvania and New York.

In the immediate Washington/Baltimore area, official storm total rainfall reports include:
Washington National  6.47 
Washington Dulles 6.44
Ft. Belvoir 13.48
Baltimore BWI 8.11
Baltimore Downtown 6.90
Andrews AFB 9.06
Patuxent River 2.13
Selected reports of 10" or more as of 2 pm today from the National Weather Service include:
...ALABAMA...
FYFFE 6.3 NNE 12.94
MOBILE 10.2 WSW 12.93
ALBERTVILLE 4.8 WNW 12.44
TILLMANS CORNER 4.3 WNW 11.74
GRAND BAY 0.6 NW 11.32
ORANGE BEACH 3.0 ENE 10.50
FOLEY 2.0 SSW 10.39

...FLORIDA...
MILTON 1.4 NNE 10.03

...GEORGIA...
LA FAYETTE 2.9 NE 11.01
RINGGOLD 5 W 10.21

...LOUISIANA...
HOLDEN 15.43
N.O. CAROLLTON 14.32
MAUREPAS 13.63
PONCHATOULA 4 SE 13.22
CONVENT 2 S 13.04
WESTWEGO 1.8 NE 13.03
RESERVE 0.5 SSE 12.89
GRAY 0.5 ENE 12.15
NEW ORLEANS/MOISANT 11.00

...MARYLAND...
WALDORF 3.6 SSE 13.63
CROFTON 1.5 NNE 11.85
ELLICOTT CITY 1.7 N 11.36
CLARKSBURG 10.60

...MISSISSIPPI...
WAVELAND 1.1 NW 14.11
FLORENCE 0.9 E 13.45
SAUCIER 6.4 ESE 11.75
GULFPORT 2.0 NE 11.71
LONG BEACH 0.7 S 11.59
PASS CHRISTIAN 5.0 N 11.31
RICHLAND 0.3 WSW 11.25
PHILADELPHIA 5.4 E 11.18
JACKSON WFO 11.15
GULFPORT-BILOXI 11.14
PASCAGOULA 10.96

...NEW YORK...
APALACHIN 3.0 SE 11.83
ENDICOTT 5.2 SSE 11.46
TIOGA TERRACE 10.64
BINGHAMTON/BROOME 10.09

...PENNSYLVANIA...
ELIZABETHTOWN 1.1 NNE 15.58
PINE GROVE 14.70
PAXTONIA 1.7 E 13.95
HARRISBURG AIRPORT 13.30
MUIR AAF/INDIANTOWN 12.58
WILLIAMSPORT 10.20

...TENNESSEE...
CLEVELAND 3 ESE 12.22
CHARLESTON 11.50
CHATTANOOGA-LOVELL FIELD (ASOS) 10.28

...VIRGINIA...
COLONIAL BEACH 1.2 SSE 20.96
WOODBRIDGE 0.5 SSW 16.20
LORTON 1.2 NE 15.09
FORT BELVOIR/DAVISON AFB 13.77
RESTON 2 N 11.45
CHANTILLY 2 ESE 10.18

Thursday, September 8, 2011

All-Time Daily Rainfall Record at Binghamton: Second in 2 Years


Image (click to enlarge): Binghamton region 24-hour precipitation ending 8 am EDT, Sept. 8, from National Weather Service

6 PM Update: As of 5 pm, an additional 1.41" of rain has fallen at Binghamton today, bringing the monthly total to 10.08" and the yearly total to 51.27". After slightly more than a week, this month's total is now the second highest all-time amount, behind the 11.45" in June 2006.

Original post:
After setting an all-time daily precipitation record just last September, Binghamton, New York has smashed that record by a wide margin with 7.49" yesterday (Sept. 7). Since the previous record was set in 2006, the 3 highest daily rainfall amounts at Binghamton have now occurred within the last 5 years. Climate records began in 1951 at the current airport location, but climate data in the city extend back to 1890. The record rainfall for any 24-hour period at the previous location was 4.55" in Sept. 1924.

The year-to-date total rainfall is also a new all-time annual record.

The National Weather Service report:
A RECORD RAINFALL OF 7.49 INCHES WAS SET AT THE BINGHAMTON REGIONAL
AIRPORT YESTERDAY. THIS BREAKS THE OLD RECORD FOR SEPTEMBER 7TH OF
0.80 INCHES SET IN 1996.

THIS CALENDAR DAY RAINFALL ALSO SHATTERS THE RECORD FOR ANY DAY.
THE OLD RECORD WAS 4.24 INCHES ON SEPTEMBER 30TH IN 2010.

PRECIPITATION FOR THE YEAR NOW TOTALS 49.86 INCHES AS OF MIDNIGHT.
THIS BREAKS THE OLD RECORD FOR ANY YEAR OF 49.78 INCHES SET IN 2006.
NORMAL PRECIPITATION FOR REST OF THE YEAR IS CLOSE TO 10 INCHES SO
THIS SHOULD BREAK THE RECORD BY MANY INCHES.

Record River Flooding Forecast for Susquehanna Valley in PA, NY

Sept. 8, 4 PM Update: Added storm rainfall map.

Sept. 8, 2 PM Update: As of 2 pm, the river stage of 25.6 ft at Binghamton is above the old record. The current forecast crest is 26.2 ft.

Vestal is at 35.3 ft, which is over 1 foot above the old record, and the forecast crest is 36.9 ft.

The new forecast crest of 40.7 feet at Wilkes Barre is just 0.2 ft below the all-time record from storm Agnes in 1972.

Original post:
The record daily rainfall at Harrisburg on Wednesday was part of extremely heavy precipitation throughout the Susquehanna River watershed. As of midnight, the river depth of 16.4 ft. at Harrisburg was just below the flood stage of 17 feet. The crest of 26.2 feet predicted for Saturday would be the 4th highest on record at Harrisburg.

Upstream, the forecast 38.5 feet at Wilkes Barre would be the 2nd highest on record. At Vestal, New York, the current 30.5 feet is well above major flood stage, and the forecast of 34 feet would be an all-time record. The current 20.5 feet at Binghamton is also at major flood stage, and the forecast 26 feet early Thursday afternoon would beat the all time record of 25 feet on June 28, 2006.

Images (click to enlarge):
- Pennsylvania storm rainfall total, Sept. 4-8, 2011, from National Weather Service
- Observed and forecast river stages at Harrisburg, Wilkes Barre, Vestal, and Binghamton, from National Weather Service

Wednesday, September 7, 2011

Record Daily Rainfall for September at Harrisburg

Sept. 8, 2 PM Update: The final Harrisburg daily rainfall total for Sept. 7 is 7.71". The 2-day total is 9.73". The storm total since Sunday evening is 13.30" as of 9 am today.

Sept. 8, 1 AM Update: Heavy rain has continued through midnight at Harrisburg, with 2.08" just in the hour ending at 1 am EDT (midnight standard time). That puts the daily total at the 2nd highest of all time.

Original post:
Downpours from the remnants of Tropical Storm Lee have been producing record rainfall amounts in the Mid Atlantic area. The National Weather Service reports that the 5.05" of precipitation as of 5 pm today at Harrisburg, Pennsylvania has already smashed the old daily record of 1.18" set in 1998. Unofficially, this is also an all-time daily record for September, beating the 4.59" on Sept. 26, 1975. The top two all-time daily rainfall records at Harrisburg were set on June 21 and 22, 1972 from the remnants of Hurricane Agnes. Today's amount is now the 3rd highest all-time amount.

The 2-day total on Sept. 25-26, 1975 was 8.87". Together with the 2.02" yesterday, the current 2-day total is 7.07". Climate records began at Harrisburg in 1888.

The previous top 10 daily rainfall amounts at Harrisburg:
22-Jun 1972 9.13
21-Jun 1972 5.81
31-May 1889 4.66
23-Aug 1933 4.66
26-Sep 1975 4.59
14-Sep 1973 4.34
21-Aug 1915 4.30
25-Sep 1975 4.28
10-Sep 1907 4.17
23-Jul 1969 4.00
Image (click to enlarge): Mid Atlantic radar image September 7, 2011, from Accuweather

Seasonal Outlook

Latest seasonal forecast: Click here.


Latest 3-month temperature outlook from Climate Prediction Center/NWS/NOAA.