Saturday, August 15, 2009

Tropical Update: Bill is Born
Advisories for Ana

Satellite imagery indicates that the Tropical Depression formerly known as Three has become better organized and is now Tropical Storm Bill with maximum winds of 40 mph. Bill is in the deep tropics, further south than Ana, and is well within the easterly trade winds. It's moving steadily a little south of due west around 16 mph, and a gradual turn to the west-northwest is expected. Bill has a large circulation and has favorable conditions for development, including light wind shear and warm water temperatures. It is expected to become a hurricane within 4 days.

Meanwhile, little sister Ana still has maximum winds of 40 mph as it continues moving westward at 17 mph. The Netherlands Antilles government has issued a tropical storm watch for St. Maarten, Saba, and St. Eustatius.

Images (click to enlarge): Tropical Storms Bill and Ana forecast tracks from National Hurricane Center

Tropical Season Heats Up: Ana Arrives
Brother Bill Behind?

After being given up for dead, the remnants of Tropical Depression 2 organized enough this morning to become Tropical Storm Ana, the first of the 2009 Atlantic season. Meanwhile, a larger tropical wave to the southeast of Ana has become Tropical Depression 3; it is likely to develop into Tropical Storm Bill in the next day or so.

At 11 am AST/EDT, Ana's maximum winds were 40 mph, and some slow strengthening is predicted. Movement is toward the west at 16 mph, with a gradual turn to the west-northwest expected. This track could bring the storm near the Leeward Islands by Monday. Ana is a small storm, and it is moving through a hostile environment of westerly wind shear and dry air, but the forecast track takes it over increasingly warm water. Most of the intensity models indicate that it could develop into a hurricane. Given the conflicting influences, however, the intensity forecast is more uncertain than usual; the official forecast keeps it lower than the models, at tropical storm strength.

Tropical Depression 3 formed late this morning in the eastern Atlantic. Maximum winds are 35 mph and movement is westward at 17 mph from a position about 740 miles west-southwest of the Cape Verde Islands. The intensity forecast calls for the depression to become a tropical storm in the next 12 hours and a hurricane within 3 to 4 days. All of the intensity models are predicting hurricane strength, with one of them forecasting a major hurricane. If it develops as expected, the storm will be named Bill.

Images (click to enlarge): Tropical Storm Ana and Tropical Depression 3 forecast tracks from National Hurricane Center

Friday, August 14, 2009

NOAA Reports 5th Warmest July on Record Globally
Ocean Temperature Warmest on Record


NOAA's National Climatic Data Center (NCDC) late Thursday released its preliminary analysis of July 2009 global temperatures. It found that the global average land and ocean surface temperature was the 5th warmest on record, 0.57°C (1.03°F) above the 20th century average of 15.8°C (60.4°F). The ocean surface temperature broke the 1998 record to become the warmest for the month of July at 0.59°C (1.06°F) above the 20th century average of 16.4°C (61.5°F). The departure from the long-term average was equal to June's record amount. Other highlights from the NCDC report:
  • July 2009 was the 33rd consecutive July with an average global land and ocean surface temperature above the 20th century average. The last July with global temperatures below the 20th century average occurred in 1976.
  • The global land surface temperature for July 2009 was 0.51°C (0.92°F) above the 20th century average of 14.3°C (57.8°F), and tied with 2003 as the ninth-warmest July on record.
  • For the year to date, the global combined land and ocean surface temperature of 14.3°C (57.9°F) tied with 2004 for the sixth-warmest January-through-July period on record.

Thursday, August 13, 2009

Tropical Depression 2 Fades Away
Prospects for Next System Look Stronger

August 15 Update: TD 2 has revived and become Tropical Storm Ana.

Original post:
Unlike the little engine that could, Tropical Depression 2 was the heat engine that couldn't. The system, small in size to begin with, struggled against increasingly dry surrounding air and unfavorable wind shear until it faded away to a remnant low pressure area with maximum winds of 30 mph this afternoon. The last official advisory was issued by the National Hurricane Center at 5 pm today.

The next system, a tropical wave about 250 miles south of the Cape Verde Islands, is becoming better organized, and it's being given a high chance (greater than 50%) of becoming a tropical cyclone in the next couple of days.

Image (click to enlarge): Atlantic tropical cyclone activity map from National Hurricane Center

Wednesday, August 12, 2009

Texas Heat Records Continue Falling

For previous record temperature posts, see:
Record Heat
Record Cold


The persistent heat of Summer 2009 continues to break records in Texas, especially in the southern part of the state. For Corpus Christi and Victoria, the National Weather Service reports:
MUCH ABOVE NORMAL TEMPERATURES HAVE CONTINUED ACROSS SOUTH TEXAS   
FOR THE MONTH OF AUGUST AFTER RECORD HEAT WAS OBSERVED FOR THE
MONTHS OF JUNE AND JULY. THE CURRENT HEAT WAVE IS BYPASSING RECORDS
FOR THE SUMMER PERIOD SET IN 1953 AND 1998 FOR BOTH CORPUS CHRISTI
AND VICTORIA.

RECORDS ARE ALSO BEING SET FOR LONGEVITY FOR ABOVE NORMAL MAXIMUM
TEMPERATURES. CORPUS CHRISTI HAS SEEN HIGH TEMPERATURES ABOVE 95
DEGREES FOR 36 STRAIGHT DAYS AND COUNTING AS OF AUGUST 12TH. THIS
BREAKS THE MARK OF 26 DAYS SET IN SEPTEMBER OF 2005. FOR THE
VICTORIA AREA...THE STREAK OF 36 DAYS ABOVE 96 DEGREES SURPASSES
HEAT WAVES THAT OCCURRED IN THE EARLY 1900S (1911, 1912, 1917).
IF IT WERE NOT FOR ONE MINOR COOL DOWN ON JULY 7TH...THE STREAKS
FOR BOTH CORPUS CHRISTI AND VICTORIA WOULD BE ABOVE 50 DAYS.

EXCEPTIONAL DROUGHT CONTINUES FOR SOUTH TEXAS WITH YEARLY RAINFALL
DEFICITS AT 13.59 INCHES FOR CORPUS CHRISTI...AND 16.72 INCHES AT
VICTORIA AS OF AUGUST 11TH. THE CURRENT DROUGHT IS ON PAR WITH THE
DROUGHT THAT OCCURRED IN 1917 ACROSS SOUTH TEXAS.

CLIMATE RANKINGS THROUGH AUGUST 11TH 2009 FOR THE CORPUS CHRISTI AND
VICTORIA AREAS.

CORPUS CHRISTI (PERIOD OF RECORD 1887-2009)...

HIGHEST JUNE MONTHLY MEAN OF 'DAILY AVERAGE TEMPERATURE' DEGREES F

RANK VALUE ENDING DATE
1 85.8 1998, 1953
3 85.0 2009

HIGHEST JULY MONTHLY MEAN OF 'DAILY AVERAGE TEMPERATURE' DEGREES F

RANK VALUE ENDING DATE
1 87.9 2009
2 87.1 1953
3 86.6 1998

HIGHEST MEAN OF 'DAILY AVERAGE TEMPERATURE' FROM JUNE 1-AUGUST 11

RANK VALUE ENDING DATE
1 86.7 2009
2 86.6 1953
3 86.2 1998

YEARLY TOTAL NUMBER OF DAYS WITH MAXIMUM TEMPERATURE ABOVE 95
DEGREES F

RANK VALUE ENDING DATE
1 64 2009 (AS OF AUGUST 12)
2 62 1953
3 56 2005

CONSECUTIVE DAYS
MAXIMUM TEMPERATURE > 95.0 DEGREES F

RANK #DAYS END DATE
1 36 8/12/2009 (CURRENT ACTIVE STREAK)
2 26 9/01/2005
3 25 8/04/1998
4 20 7/30/2000
5 19 8/22/1997
6 18 7/06/2009

LOWEST TOTAL PRECIPITATION INCHES
SEPTEMBER 1ST - AUGUST 11TH
PERIOD: 345 DAYS
YEARS: 1888-2009

RANK VALUE ENDING DATE
1 5.73 7/30/1917
2 8.37 7/30/2009 *
3 9.85 7/30/1962

EXTREMES
LOWEST TOTAL PRECIPITATION INCHES
YEAR TO DATE TOTAL
YEARS: 1887-2009

RANK VALUE ENDING DATE
1 3.13 1917
2 3.37 1953
3 3.65 2009 *

=====================================================================

VICTORIA (PERIOD OF RECORD 1902-2009)

HIGHEST MONTHLY JULY MEAN OF 'DAILY AVERAGE TEMPERATURE' DEGREES F

RANK VALUE ENDING DATE
1 88.1 2009
2 87.2 1998
3 87.0 1969

HIGHEST MEAN OF 'DAILY AVERAGE TEMPERATURE' FROM JUNE 1-AUGUST 11

RANK VALUE ENDING DATE
1 86.6 2009, 1998
3 86.0 1953

CONSECUTIVE DAYS
MAXIMUM TEMPERATURE > 96.0 DEGREES F

RANK # DAYS END DATE
1 36 8/12/2009 (CURRENT ACTIVE STREAK)
2 33 8/15/1912
3 31 9/20/1912
4 27 8/28/1917, 8/28/1911

DRIEST JANUARY THROUGH JULY PERIOD
(PERIOD OF RECORD 1893-2009)

1. 6.84 2009
2. 7.73 1917
3. 8.52 1925

Tuesday, August 11, 2009

Tropical Depression 2 Forms in Atlantic
Potential to Become Ana

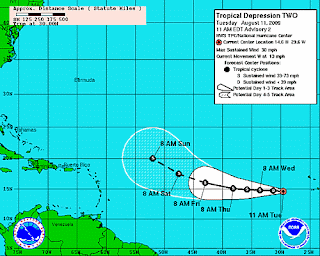
The second tropical depression of the season formed in the Atlantic early this morning near the Cape Verde Islands. As of 11 am EDT, maximum winds were near 30 mph with some higher gusts. The depression was moving west at 13 mph, and this track is expected to continue for the next couple of days. Some slow strengthening is predicted, and the depression has the potential to become Tropical Storm Ana. However, sea surface temperatures along the track are only marginally warm, and there is drier air in the middle levels of the atmosphere. On the other hand, vertical wind shear is expected to be light for the next several days, which should encourage strengthening.

Image (click to enlarge): Tropical Depression 2 forecast track from National Hurricane Center

Minimally Record Heat Reaches Mid Atlantic

For previous record temperature posts, see:
Record Heat
Record Cold


After a somewhat cool July, near record heat reached the Mid Atlantic area on August 10. The only record set appears to have been for the relatively shorter observation history at Washington Dulles (since 1963):
A RECORD HIGH TEMPERATURE OF 97 DEGREES WAS SET AT WASHINGTON   
DULLES DC TODAY. THIS BREAKS THE OLD RECORD OF 96 SET IN 2001.
The all-time August record at Dulles is 104° on the 20th in 1983.

Monday, August 10, 2009

Austin Sets 155-Year Monthly Heat Record

For other record temperature posts, see:
Record Heat
Record Cold


The National Weather Service reports that Austin, Texas broke its all-time monthly heat record in July. Records in Austin date back to 1854. San Antonio also had its hottest month since records began there in 1885. San Antonio also broke its record for the number of 100-degree days in a month.
JULY 2009 WAS THE WARMEST JULY AND ALL-TIME MONTH AT AUSTIN MABRY
FROM 1854 TO JULY 2009 AND AT SAN ANTONIO FROM 1885 TO JULY 2009.
AT DEL RIO...JULY 2009 WAS THE 3RD WARMEST JULY AND 3RD WARMEST
MONTH FROM 1906 TO JULY 2009. THE AVERAGE TEMPERATURE FOR JULY 2009
WAS 89.5 AT AUSTIN MABRY...90.0 AT DEL RIO...88.7 AT SAN ANTONIO...
AND 87.8 AT AUSTIN BERGSTROM.

THE TABLE BELOW LISTS THE WARMEST JULYS OF RECORD.

AUSTIN MABRY 1854 TO 2009

1. 89.5 JULY 2009...ALSO WARMEST ALL-TIME MONTH 1854 TO JULY 2009
2. 89.1 JULY 1860
3. 88.3 JULY 1879 AND JULY 1884
4. 88.0 JULY 1998

AUSTIN BERGSTROM 1943 TO 2009

1. 88.5 JULY 1954
2. 88.2 JULY 1994
3. 88.0 JULY 1956 AND JULY 1957
4. 87.9 JULY 1980
5. 87.8 JULY 2009 AND JULY 1951

DEL RIO 1906 TO 2009

1. 91.7 JULY 1998
2. 90.1 JULY 1980
3. 90.0 JULY 2009
4. 89.7 JULY 1953 AND JULY 2000

SAN ANTONIO 1885 TO 2009

1. 88.7 JULY 2009...ALSO WARMEST ALL-TIME MONTH 1885 TO JULY 2009
2. 88.1 JULY 1980 AND JULY 1998
3. 87.9 JULY 1994
4. 87.3 JULY 1996

THE TABLE BELOW SHOWS THE NUMBER OF 100 DEGREE DAYS IN JULY 2009 AT
LOCATIONS ACROSS SOUTH CENTRAL TEXAS. THE 22 100 DEGREE DAYS AT
SAN ANTONIO IN JULY 2009 BROKE THE OLD RECORD OF 21 DAYS FOR 100
DEGREE DAYS IN JULY AND ANY MONTH...PREVIOUSLY SET IN JULY 1998.

LOCATION NUMBER OF 100 DEGREE DAYS
IN JULY OF 2009

NEW BRAUNFELS MUNICIPAL AIRPORT..........27
SAN ANTONIO STINSON FIELD................26
AUSTIN MABRY.............................26
HONDO....................................25
UVALDE...................................25
SAN MARCOS...............................25
DEL RIO..................................24
LA GRANGE................................23
AUSTIN BERGSTROM INTERNATIONAL AIRPORT...23
SAN ANTONIO INTERNATIONAL AIRPORT........22
GIDDINGS.................................20
KERRVILLE................................19
PLEASANTON...............................17
LLANO....................................17
BURNET...................................13

Felicia Approaches Hawaii

Image (click to enlarge): Tropical Storm Felicia forecast track from Central Pacific Hurricane Center.

5 pm HST Update: Felicia has weakened slightly to maximum winds of 40 mph, and movement is to the west at 10 mph from a position about 210 miles east-northeast of Hilo, Hawaii and 375 miles east of Honolulu.

Original post:
Tropical Storm Felicia, with maximum winds now down to 45 mph, continues on a track toward Hawaii. At 11 am HST, the storm was moving westward at 12 mph. The Central Pacific Hurricane Center reports the following storm watches:
 AT 1100 AM HST...2100 UTC...THE TROPICAL STORM WATCH FOR THE BIG 
ISLAND HAS BEEN DISCONTINUED. A TROPICAL STORM WATCH REMAINS IN
EFFECT FOR OAHU AND FOR ALL OF MAUI COUNTY...WHICH INCLUDES THE
ISLANDS OF MAUI...KAHOOLAWE...LANAI...AND MOLOKAI. A TROPICAL
STORM WATCH MEANS THAT TROPICAL STORM CONDITIONS ARE POSSIBLE
WITHIN THE WATCH AREA...IN THIS CASE WITHIN THE NEXT 36 HOURS.
The storm is expected to reach the islands on Tuesday as a tropical depression or possibly a weak tropical storm.

Sunday, August 9, 2009

Tropical Storm Felicia Continues Toward Hawaii

After weakening to a tropical storm over the weekend, Felicia has shown little change in strength Sunday afternoon. At 5 pm HST, the storm was moving westward at 14 mph; maximum winds were near 50 mph. The Tropical Storm Watch has been extended to the island of Oahu:
A TROPICAL STORM WATCH IS NOW IN EFFECT FOR THE BIG ISLAND OF HAWAII
...FOR ALL OF MAUI COUNTY...WHICH INCLUDES THE ISLANDS OF MAUI...KAHOOLAWE...
LANAI...AND MOLOKAI...AND FOR THE ISLAND OF OAHU.

REGARDLESS OF THE STRENGTH OF FELICIA WHEN IT REACHES THE HAWAIIAN
ISLANDS...HEAVY RAINS ARE STILL EXPECTED TO OCCUR AND FLASH
FLOODING REMAINS A POSSIBILITY.

...SUMMARY OF 500 PM HST INFORMATION...
LOCATION...21.2N 148.4W
MAXIMUM SUSTAINED WINDS...50 MPH
PRESENT MOVEMENT...WEST OR 280 DEGREES AT 14 MPH

Seasonal Outlook

Latest seasonal forecast: Click here.


Latest 3-month temperature outlook from Climate Prediction Center/NWS/NOAA.