Saturday, December 24, 2011

The Quest for Energy: Good News and Bad News

The good news: There's plenty of oil.
The bad news: We're going to burn it all.
Author Daniel Yergin discusses his book The Quest on the PBS News Hour; unlike in some previous interviews, the subject of climate is actually raised:

Watch Author Daniel Yergin on U.S. Need for a 'Diversified Energy Portfolio' on PBS. See more from PBS NewsHour.

Thursday, December 22, 2011

Pre-Christmas Heat Update: Records Set in NY, NJ, PA, DE, MD, VA

Preliminary data from the National Climatic Data Center show that at least 13 major daily high temperature records were set or tied yesterday from Virginia to New York (alphabetically by state):
                                    Previous         Period of
Location Record Date Record (yr)
DE WILMINGTON NEW CASTLE (KILG) 62 58 12/21/1949 67
NJ ATLANTIC CITY INTL AP (KACY) 63 61 12/21/1973 64
NJ NEWARK INTL AP (KEWR) 62 61 12/21/1957 76
NJ MILLVILLE MUNI AP (KMIV) 61 60 12/21/1990 61
NY NY CITY CNTRL PARK (KNYC) 62 62 12/21/1923 135
NY NEW YORK LA GUARDIA AP (KLGA) 61 59 12/21/1993 63
NY NEW YORK JFK INTL AP (KJFK) 59 57 12/21/1957 63
NY WESTCHESTER CO AP (KHPN) 59 57 12/21/2002 49
PA PHILADELPHIA INTL AP (KPHL) 63 59 12/21/1990 70
PA MIDDLETOWN HARRISBG AP (KMDT) 59 59 12/21/1998 67
PA DUBOIS FAA AP (KDUJ) 54 54 12/21/1988 44
PA BRADFORD RGNL AP (KBFD) 53 51 12/21/1988 54
VA WASHGTN DULLES INTL AP (KIAD) 61 60 12/21/1998 49
As previously noted, a record was also set at Baltimore.

The total number of daily low temperature records set or tied in all 50 states yesterday: 1.

Wednesday, December 21, 2011

Pre-Christmas Warmth Breaks Mid-Atlantic Temperature Records


Image (click to enlarge): Surface temperature at 11 pm EST, December 21, 2011, from Unisys

Southerly winds ahead of a strong storm system have broken daily temperature records from Virginia to New York this evening. At Kennedy Airport, New York the previous record high for December 21 was 56° in 1973, but the 11 pm temperature is 57°, where it has been for the last 2 hours. Other preliminary records set or tied (previous records in parentheses) include:
LaGuardia NY          61° (59°, 1993 and 1973)
Atlantic City NJ 63° (62°, 1923)
Reading PA 61° (tie, 1923)
Washington Dulles VA 61° (60°, 1998 and 1971)
Baltimore/BWI MD 63° (61°, 1956 and 1885)
Earlier this evening, the temperature at Central Park, New York, where records began in 1869, reached at least 61°, but the record high there was 62° in 1923.

Wednesday, December 14, 2011

Record Daily Rainfall Pushes Chicago Toward 2nd Wettest Year

December 15 Update: Yesterday's final rainfall total of 1.43" exceeded the old daily record at Chicago by over 40%. The monthly total to date, including an additional 0.02" today, brings the annual amount to 49.20", only 0.15" below the second highest on record.

Original post:
Today's heavy rainfall at Chicago set a daily record for December 14 and pushed the annual total closer to the second wettest year in 140 years of records. The 1.13" reported in the preliminary daily summary as of 4 pm CST exceeded the 0.99" first observed in 1907 and tied in 1975. The year to date total of 48.88" is 36% above the normal amount of 35.83". This is the third highest annual total, behind:
1) 2008   50.86"   
2) 1983 49.35"
The 1.35" at Peoria also exceeded the daily record of 1.14" in 1975. The year to date total there of 39.12", however, is behind the 41.29" last year.

The 0.5" of snow so far this month at Chicago is well below the average amount of 3.3". Last year at this time, the monthly total was 6.9". Temperatures so far in December have averaged 4.2° above normal.

Thursday, December 8, 2011

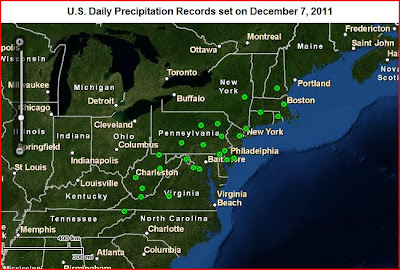
Precipitation Records Broken Tennessee to New England


Images (click to enlarge): 24-hour precipitation ending 7 am EST, December 8, 2011, from National Weather Service; Locations of daily precipitation records, December 7, 2011, from National Climatic Data Center

In addition to the all-time cold-season (November-March) daily rainfall record set at Washington, DC, records were also broken at 25 other major reporting locations (ASOS stations) on December 7. According to preliminary data from the National Climatic Data Center, the following new daily rainfall records were set from Tennessee to New England (alphabetical by state, amounts in inches):
State Location                        New     Old     Date   Years of Record
CT HARTFORD (KBDL) 2.05 1.8 12/7/1976 69
DE WILMINGTON NEW CASTLE (KILG) 1.94 1.09 12/7/1976 69
MA BOSTON (KBOS) 1.6 1.15 12/7/1959 91
NH CONCORD ASOS (KCON) 1.52 1.2 12/7/1976 90
NJ MILLVILLE MUNI AP (KMIV) 2.46 1.94 12/7/1971 64
NJ NEWARK INTL AP (KEWR) 1.9 1.26 12/7/1996 76
NJ ATLANTIC CITY INTL AP (KACY) 1.55 1.46 12/7/1971 64
NY WESTCHESTER CO AP (KHPN) 1.55 1.45 12/7/1976 62
NY ALBANY INTL AP (KALB) 1.43 0.88 12/7/1976 73
PA PHILADELPHIA INTL AP (KPHL) 2.04 1.14 12/7/1996 70
PA ALLENTOWN AP (KABE) 1.72 1.54 12/7/1976 63
PA WILLIAMSPORT RGNL AP (KIPT) 1.55 1.37 12/7/1976 63
PA WILKES-BARRE INTL AP (KAVP) 1.32 1.04 12/7/1976 62
PA ALTOONA FAA AP (KAOO) 1.31 1.04 12/7/1976 62
PA MIDDLETOWN HARRISBG AP (KMDT) 1.25 0.95 12/7/1959 76
RI PROVIDENCE (KPVD) 1.55 1.43 12/7/1976 69
TN BRISTOL AP (KTRI) 1.46 1.25 12/7/1957 63
VA WASHINGTON REAGAN AP (KDCA) 3.1 1.34 12/7/1971 75
VA WASHGTN DULLES INTL AP (KIAD) 2.14 1.13 12/7/1976 49
VA LYNCHBURG INTL AP (KLYH) 1.8 1.13 12/7/1976 81
WV ELKINS RANDOLPH CY AP (KEKN) 1.8 1.35 12/7/1957 85
WV BLUEFIELD MERCER CO AP (KBLF) 1.71 0.72 12/7/1996 52
WV BECKLEY RALEIGH CY AP (KBKW) 1.66 0.85 12/7/1971 48
WV MARTINSBURG E WV RGNL AP (KMRB) 1.46 1.05 12/7/1976 85
WV CHARLESTON YEAGER AP (KCRW) 1.3 0.89 12/7/1950 63
WV MORGANTOWN HART FLD (KMGW) 1.11 0.95 12/7/1976 66
In addition to the Washington, DC record, the Bluefield report is also an all-time December daily record.

Wednesday, December 7, 2011

Rainfall Sets Mid-Atlantic Records;
Update: Wettest December Day in History

1 AM Update: The final record-breaking total daily rainfalls:
Washington National 3.10" (1.34", 1971)
Washington Dulles 2.14" (1.13", 1976)
Baltimore/BWI 2.38" (1.27", 1976)
The Washington National amount exceeded the normal monthly precipitation of 3.05" for December.

10 PM Update: With 0.14" more rain in the past hour, the daily total is unofficially over 3" for the first time in ANY MONTH from November through March! Here are the previous daily records for each month:
Nov 2.95" 1943
Dec 2.81" 1977
Jan 2.77" 1915
Feb 2.29" 1896
Mar 2.79" 1881
9 PM Update: Washington National has now had just under 1" of additional rainfall since 4 pm, bringing the total to 2.91". This is now unofficially the wettest December day since precipitation records began in 1871, exceeding the old record of 2.81" on December 18, 1977.

Original post:
Cold-season precipitation extremes tend to be lower than those in warmer seasons because cold air holds less moisture than warm air. With heavy rainfall still falling, however, daily precipitation records for December 7 have already been set as of 4 pm in the Mid Atlantic area. Current totals (old records in parentheses):
Washington National 1.93" (1.34", 1971)
Washington Dulles 1.33" (1.13", 1976)
Baltimore/BWI 1.18" (1.27", 1976)
Note: The Baltimore record was easily exceeded by the 0.54" which fell in the next 3 hours.

Monday, December 5, 2011

U.S. Fall Heat Records Decline From Summer's Torrid Pace;
2011 Ratio to Date Nearly 3 to 1

Following summer's spectacular pace of over 11 daily heat records for every cold record in the U.S., the ratio for meteorological autumn (September-November) declined to 1.8 to 1. While November's ratio of 1.7 to 1 was well below the August peak of 22.2 to 1, it was the 11th consecutive month in which heat records exceeded cold records. December 2010 was the only month since February of last year in which cold records outnumbered record highs. For the year 2011 to date, the cumulative ratio is 2.9 to 1, vs. 2.3 to 1 for 2010.

Preliminary NOAA/NCEP data show that fall temperatures averaged above the new 1981-2010 base period over much of the U.S., particularly along the northern border and into Canada. Temperatures averaged at least 2°C above normal across the northern Plains and northern New England. The only significant area of below average temperatures was in parts of the Southeast, including Georgia, Alabama, southern Mississippi, southern South Carolina, and northern Florida.

More details on November's temperatures should be available later this week when the National Climatic Data Center issues its State of the Climate National Overview.

Images (click to enlarge):
- Monthly ratio of daily high temperature to low temperature records set in the U.S. for November 2010 through November 2011 and seasonal ratio for summer and fall 2011, data from NOAA National Climatic Data Center, background image © Kevin Ambrose (www.weatherbook.com). Includes historical daily observations archived in NCDC's Cooperative Summary of the Day data set and preliminary reports from Cooperative Observers and First Order National Weather Service stations. All stations have a Period of Record of at least 30 years.
- U.S. September-November 2011 temperature departure from climatological average from NOAA/NCEP via ESRL

Seasonal Outlook

Latest seasonal forecast: Click here.


Latest 3-month temperature outlook from Climate Prediction Center/NWS/NOAA.