Wednesday, August 17, 2011

Mid-August Update: Oklahoma on Track for Hottest Summer on Record


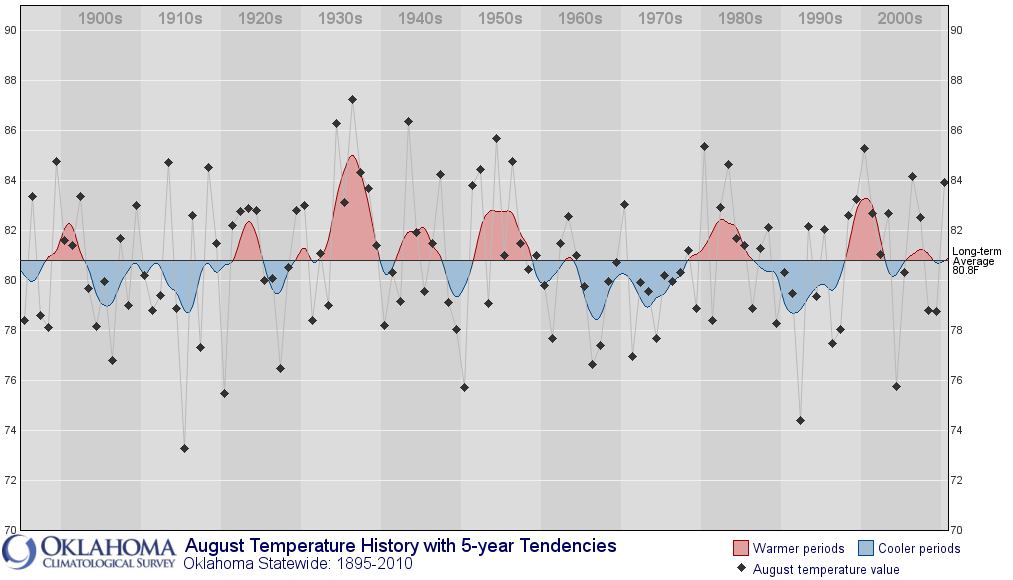
Images (click to enlarge): Oklahoma August and summer average temperature history for 1895-2010, from Oklahoma Mesonet; U.S. average temperatures and departures from climatology, Aug. 1-15, from Climate Prediction Center/NWS

With 2 weeks left to go in meteorological summer, the Oklahoma Mesonet reports that the state is on track to record its hottest summer in climate history, dating back to 1895:
We're 5/6ths of the way through the climatological summer (June-August) and the 

handwriting is on the proverbial wall ... this will probably end up as the warmest
summer on record in Oklahoma, dating back to 1895. Through August 16, the
statewide average temperature for August was 87.7 degrees. The warmest August
on record was the 87.2 degrees that occurred in 1936.

So that puts us 0.5 degrees ahead of 1936's August as the warmest on record. That
comes after our second warmest June and warmest July on record, so the race for
the warmest summer is obvious. For June 1- August 16, the statewide average
temperature as measured by the Mesonet was 86.7 degree. That puts us well ahead of
the warmest summer on record set by 1934's 85.2 degrees.

The average high temperature across the state during August has been 101.6
degrees, ranging from 104.9 degrees in the southwest to 97.9 degrees in the
Panhandle. For the summer, the average high across the state was 100.3 degrees,
ranging from 103.7 degrees in the southwest to 98.3 degrees in east central
Oklahoma.

Tuesday, August 16, 2011

New Zealand Snow: Once in 50 Year Event

August 17 Update: From WeatherWatch:
In Christchurch some snow is falling off and on across the city with heavier falls well inland. Weather analyst Richard Green says there have been a few power outages too across Canterbury as a result of the snow.

WeatherWatch.co.nz says the temperature right now in Christchurch is 2 degrees with a wind chill of minus 4.

But, despite the snow flakes, conditions are generally improving.

The intensity of the showers has significantly eased across more than 80% of New Zealand and while sleet and rain/snow showers are continuing to affect some coastal parts of Canterbury the centre of the storm is moving away.

Head weather analyst Philip Duncan says the centre of the low is now 2500kms south east of Christchurch and moving eastwards away from New Zealand. He says a secondary low will form just east of the Chatham Islands tomorrow causing conditions to linger a little longer. "The main event has well and truly passed now but we're still being affected by the tail end, so more heavy snow down to a few hundred metres from Canterbury to Hawkes Bay and wintry, sleety, conditions to sea level".

He says the secondary low won't add too much more to the weather here but will just keep "today's weather in place until Thursday".

In Wellington the snow level has lifted but a gale force southerly continues to blast through. It's currently 7 degrees with a feels like temperature of zero in the wind.

In Auckland a thin veil of high cloud and a fairly light southerly are the only signs that a winter storm was nearby.

Similar weather is expected tomorrow across New Zealand with significant improvements spreading into more regions by Friday.

By the weekend the large high partially responsible for the winter blast will move in and settle across New Zealand for the first half of next week.

WeatherWatch.co.nz says by the end of next week temperatures will be back to average or even above average if a warm northerly air stream from the sub-tropics eventuates. This is currently being predicted by some long range models - we'll keep you posted!

Original post:
A very strong outbreak of Antarctic air, which began moving into New Zealand on Sunday, has produced unusually widespread snowfall which the official New Zealand MetService has called a once-in-50-year event. The influx of a deep layer of cold air flowing almost directly from the Antarctic continent over much warmer sea water allowed the development of heavy "ocean effect" snow showers.

The weather map to the right shows a very strong 1034 mb high pressure area pumping cold air counter-clockwise from Antarctica to New Zealand. (New Zealand is located in the lower left of the map, with the high centered to the south. Antarctica is near the center of the lower part of the map.) The red line on the lower map shows the trajectory of air arriving at Auckland on August 15.

The 3 to 5 cm. of snow which fell above an elevation of 100 meters for at least an hour late Sunday afternoon was characterized as the "heaviest and most widespread snowfall in Wellington City for at least 30 50 years." Wellington is located on the southern end of North Island.

Although temperatures have been cold for this event, they have not been widely extreme. The 8.1°C high at Auckland Airport on Monday was an all-time record low maximum, but official climate data began there only in 1966. The 4.6°C at Christchurch Airport, by contrast, was exceeded in July 2007. At Waiouru, elevation about 2700 feet, the Monday low of -7.7°C was a new monthly record for August.

According to WeatherWatch,
[H]eavy snow is likely to set in again across Wellington tonight as the snow returns to the city this afternoon.

The late afternoon surge, which WeatherWatch.co.nz predicted this morning, has seen the temperature plunge to 1 degree with a wind chill of -5.

Head weather analyst Philip Duncan says the snow will spread across the lower North Island again but may not affect quite so many main centres to the north west of the city. "Snow is expected to be heavy around Wellington, Upper Hutt and Wairarapa tonight with a moderate risk of snow flakes returning to low levels of the lower North Island like Wanganui and Taranaki".

Mr Duncan says the heavy snow in Wellington is likely to come and go all night with snow easing tomorrow morning. Snow will move into Hawkes Bay and Gisborne region too, to 100 or 200 metres.

Meanwhile Christchurch and other coastal parts of Canterbury could see more snow tonight. Weather analyst Richard Green says snow showers may return to the city tonight, but should ease in the early hours of Wednesday. Snow isn't expected to be as heavy as it was yesterday with passing snow flurries. However he says the city is definitely 50/50 for snow. "The freezing level has lifted just enough so that Christchurch, Timaru and Ashburton are all on the borderline of snow. It's an extremely fine line between sleet, rain and snow for those centres tonight but we don't expect the falls to be long lasting and heavy as they were last night".

Snow has already started to melt and turn to slush with rain showers and sleet today in the garden city.

In Dunedin a few brief snow flurries are possible but conditions there should be easing further as we head into Wednesday.

And Auckland's chance of seeing snow is quickly fading. A large shower this afternoon saw graupel and sleet in some areas while snow was confirmed on the tops of the Waitakere Ranges this morning in to around 300m from a passing snow shower.
See the New Zealand Herald for a video gallery of the snow in Christchurch.

Images (click to enlarge):
- Snow in Clifford Road, Johnsonville (altitude approximately 200 metres) early evening, Sunday 14 August 2011; from New Zealand MetService
- New Zealand snowfall extent from Sunday, August 14 through 2 pm Tuesday, August 16; from New Zealand MetService
- Southern Pacific Ocean sea-level pressure analysis at 10 am, August 15; from Australian Bureau of Meteorology
- Backward-projected trajectory of air parcel at 500 meters above sea level arriving at Auckland, New Zealand, midday Monday, August 15; from NOAA Air Resources Laboratory via New Zealand MetService

Monday, August 15, 2011

It's So Hot . . .

It's so hot, the Dallas weather radio transmitter is fried:
PUBLIC INFORMATION STATEMENT  

NATIONAL WEATHER SERVICE FORT WORTH TX
435 PM CDT MON AUG 15 2011

..DALLAS NOAA ALL HAZARDS RADIO IS TRANSMITTING ON LOW POWER

THE DALLAS NOAA ALL HAZARDS RADIO TRANSMITTER...WHICH BROADCASTS ON
A FREQUENCY OF 162.400 MHZ...CALL SIGN KEC 56...REMAINS UNRELIABLE
DUE TO A TRANSMITTER COOLING PROBLEM THROUGH TUESDAY...AUGUST 16TH.
THE TRANSMITTER IS BROADCASTING ON LOW POWER...BUT AT TIMES THE
TRANSMITTER MAY QUIT BROADCASTING ALL TOGETHER. WE APOLOGIZE FOR
THIS INCONVENIENCE.

July Global Land Temperatures 5th Warmest on Record

The preliminary July 2011 global climate report, posted within the past hour by the National Climatic Data Center (NCDC), shows that worldwide temperatures were the 7th warmest on record for the month of July. Some highlights from NCDC:
The combined global land and ocean average surface temperature for July 2011 was the seventh warmest on record, at 16.37°C (61.43°F), which is 0.57°C (1.03°F) above the 20th century average of 15.8°C (60.4°F).

The July worldwide land surface temperature was 0.84°C (1.51°F) above the 20th century average of 14.3°C (57.8°F)—the fifth warmest July on record.

The worldwide ocean surface temperature was 0.47°C (0.85°F) above the 20th century average of 16.4°C (61.5°F)—the 11th warmest July on record.

For the year-to-date, the global combined land and ocean surface temperature of 14.31°C (57.82°F) was the 11th warmest January–July period on record. This value is 0.51°C (0.92°F) above the 20th century average.

Large portions of each inhabited continent, particularly in the Northern Hemisphere, were substantially warmer than average during July 2011. The continental areas with the most anomalous warmth included Northern Europe, western and eastern Russia, and most of North America. Cooler-than-average conditions were present across central Russia, Western Europe, the northwestern United States, and southwestern Canada. . .

The worldwide ocean surface temperature represented the 11th warmest July on record. The warmth was most pronounced across Baffin Bay and the Labrador Sea in the Northern Hemisphere high latitudes and in the north central and northwestern Pacific Ocean. Cooler-than-average SSTs were present across much of the Eastern Pacific and the high latitude southern oceans. Neither El Niño nor La Niña conditions were present during July 2011. According to NOAA's Climate Prediction Center (CPC), ENSO-neutral conditions are expected to continue into the Northern Hemisphere fall 2011, with an equally likely chance of ENSO-neutral or La Niña conditions thereafter.
Image (click to enlarge): July 2011 global temperature departures from average, from NCDC/NOAA

Sunday, August 14, 2011

Record Rainfall Soaks New York, Philadelphia Areas


Images (click to enlarge): 24-hour precipitation for New York City region ending at 8 am EDT August 14 and 15, 2011, from National Weather Service

Note: Posting and updating delayed by Comcast's second third multi-hour outage in 6 9 days.

August 20 Update: Central Park monthly rainfall updated to 2nd wettest August.

August 15, 5:30 PM Update: Moderate to heavy showers have added almost half an inch to the Central Park total so far this hour, pushing the monthly total to the 4th wettest August.

August 15, 1 PM Update: The Central Park total is the 5th highest in records which date back to 1869. Previous daily records at Central Park:
 8.28"  September 23rd, 1882

7.57" April 15th, 2007
7.40" November 8th, 1977
7.33" October 9th, 1903
5.60" November 8th, 1972
5.54" September 21st, 1966
5.02" September 16th, 1999
4.98" October 1st, 1913
4.86" September 8th, 1934
4.80" August 16th, 1909
4.64" August 10th, 1990
4.35" October 19th, 1996
The 9.03" so far this month is already the 8th highest for August, just behind the 9.08" in 1942, and the month is only half over. The August record is 12.36" in 1990.

August 15, 12 PM Update: Updated record daily rainfall totals:
Kennedy Airpt NY 7.80" (all-time daily record)

LaGuardia NY 6.60" (second highest all-time daily amount, vs. 6.69", 4-15-2007)
Islip NY 5.32"
Central Park NY 5.81"
Newark NJ 6.40" (second highest all-time daily amount, vs. 6.73", 11-3-1977)
Trenton NJ 4.67"
Philadelphia PA 4.84"
Bridgeport CT 2.75"
Original post:
Persistent heavy showers and thunderstorms have drenched the New York/New Jersey/Connecticut tri-state area with record rainfall amounts today. Numerous daily records have been set, and JFK Airport, with a 62-year climate history, has set an all-time daily record with 7.60" as of 5 pm. The old record was 6.27" on June 30, 1984, and the August 14 record was only 0.96" in 2008.

Records were also set in the Philadelphia area. Reports from the National Weather Service:
A RECORD RAINFALL AMOUNT OF 2.21 INCHES HAS FALLEN AS OF 5 PM AT  

BRIDGEPORT CT. THIS BREAKS THE OLD RECORD OF 1.79 INCHES SET IN 1999.

A RECORD RAINFALL AMOUNT OF 3.88 INCHES HAS FALLEN AS OF 5 PM AT
ISLIP NY. THIS BREAKS THE OLD RECORD OF 1.04 INCHES SET IN 1994.

A RECORD RAINFALL AMOUNT OF 4.40 INCHES HAS FALLEN AS OF 5 PM AT
NEWARK NJ. THIS BREAKS THE OLD RECORD OF 1.11 INCHES SET IN 1999.

4.39 INCHES OF RAIN FELL AT TRENTON, NEW JERSEY SO FAR TODAY, AUGUST
14, 2011. THIS BREAKS THE OLD RECORD OF 3.4 INCHES SET IN 1999.

4.84 INCHES OF RAIN FELL AT PHILADELPHIA, PENNSYLVANIA SO FAR TODAY,
AUGUST 14, 2011. THIS BREAKS THE OLD RECORD OF 1.77 INCHES SET IN
1977.

Friday, August 12, 2011

Victoria Smashes August Heat Records


Image (click to enlarge): Southeast Australia average maximum temperature departure from normal (°C) for Aug. 1-4, 2011, from Australian BOM

A Special Climate Statement issued today by the Australian Bureau of Meteorology (BOM) reports that some all-time August heat records were set early this month in the state of Victoria:
A high pressure system centred over the NSW coast drifted into the Tasman Sea on the last weekend of July 2011. The high pressure system directed north westerly winds across Victoria. This northerly wind flow contributed to Victoria experiencing unprecedented warm weather for this time of year.

Many early season heat records were set for both warmest day and warmest night following mid winter (noting that late June/early July is typically the coldest time of year in southeast Australia). . .

In addition to early season records, a number of whole of August records were also broken. Perhaps the most significant was Melbourne2 which broke its overnight high temperature record for August on the night of the 4th when the minimum temperature was 17.3 °C. The previous warmest overnight temperature for Melbourne in August was 16.2 °C on the 20 August 1885. Similar record warmth was experienced in suburban Melbourne (Laverton and Essendon) and the Yarra Valley with an estimated 4% of Victoria experiencing the warmest August night in at least 100 years. Melbourne’s maximum temperature of 23.2 °C on the August 3rd was the warmest day in Melbourne for the first half of August and an "early season" record for Melbourne ahead of the
23.1°C set on July 30th 1975.

Perhaps the most remarkable observations during the warm spell occurred during the early hours of August 4th when many sites in coastal Victoria experienced exceptionally mild conditions. As an example, Wilson Promontory recorded a temperature of 23.5 °C at 4am, approximately 15 °C above average and easily breaking the old high temperature record of 22 °C set on 28 July 1975.
(h/t BraveNewClimate)

Wednesday, August 10, 2011

August Temperature Update: Heat Records Outnumbering Cold Records by Amazing 24 to 1

August 11 Update: There were 42 all-time record high temperature records set in the first week of August. That is over 5 times the number of all-time low temperature records set in all 3 months of last winter.

Original post:
This summer's sound of crashing temperature records has resoundingly echoed through the first week of August. For August 1-9, the number of new daily high temperature records set in the U.S. has overwhelmed the number of low temperature records by an astounding ratio of 23.9 to 1. The excess of heat records over cold records has been more than 1000. This has raised the ratio for the summer to date to almost 10 to 1 with just over 3 weeks remaining in the season.

Although the most extreme heat has been focused on Texas, Oklahoma, and Arkansas, nearly all of the country has been averaging above average temperatures except for the Pacific Coast, Nevada, and Utah.

Images (click to enlarge):
- Monthly ratios of daily high temperature to low temperature records set in the U.S. for July 2010 through Aug. 9, 2011. Data from NOAA National Climatic Data Center, background image © Kevin Ambrose (www.weatherbook.com). Includes historical daily observations archived in NCDC's Cooperative Summary of the Day data set and preliminary reports from Cooperative Observers and First Order National Weather Service stations. All stations have a Period of Record of at least 30 years.
- Preliminary U.S. average temperature and departure from normal for Aug. 1-8, 2011 from Climate Prediction Center/NWS/NOAA.

Seasonal Outlook

Latest seasonal forecast: Click here.


Latest 3-month temperature outlook from Climate Prediction Center/NWS/NOAA.