Nov. 1 Update: An additional 0.13" on Halloween brings the final monthly total to 5.71", or 2.49" above average. Here are the monthly, seasonal, and year-to-date totals for the region:
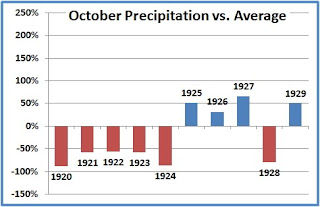
Washington National 5.71"/9.02"/35.68"PM Update: Added chart of October 1920-29.
Washington Dulles 5.70"/7.53"/38.93"
Baltimore BWI 6.24"/9.72"/42.57"

 Original post:
With 1.23" of rainfall yesterday, and an additional 0.79" through this morning, the preliminary October rainfall total for Washington stands at 5.59", over 70% above the long-term average for the month. This precipitation excess caps off a decade of October extremes. The 0.02" in 2000 was the second lowest since records began in 1871, and the 9.41" in 2005 was the record highest.
The last 5 consecutive Octobers, and 8 out of the decade 2000-2009, have all been at least 50% above or below the long-term average. The only other decade in which there have been more than 6 such extremes was the 1920s, when there were also 8. This decade's extremes have all been at least +/-55% of average, however, whereas 1925 barely made the 50% level at 50.9%.
Of the 8 extreme Octobers this decade, 5 have exceeded on the up side and 3 on the down side. The 1920s, on the other hand, excelled on the dry side, with 6 of the 8 extreme months below average.
Image (click to enlarge): Washington, DC October 2000-2009 precipitation percentage above or below average; CapitalClimate chart from NWS data


No comments:
Post a Comment